|
Download Data (XLS File) |
|
||||||||
|
||||||||
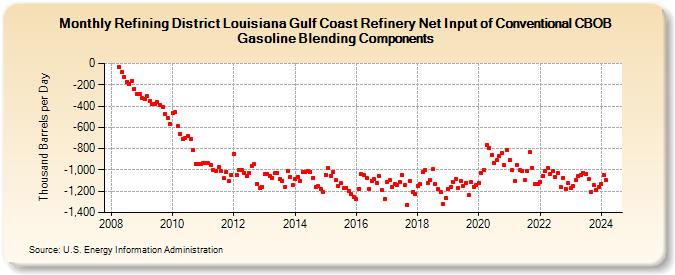
| Refining District Louisiana Gulf Coast Refinery Net Input of Conventional CBOB Gasoline Blending Components (Thousand Barrels per Day) | ||||||||
| Year | Jan | Feb | Mar | Apr | May | Jun | Jul | Aug | Sep | Oct | Nov | Dec |
|---|---|---|---|---|---|---|---|---|---|---|---|---|
| 2008 | -35 | -79 | -126 | -170 | -195 | -163 | -241 | -283 | -285 | |||
| 2009 | -325 | -336 | -309 | -357 | -383 | -383 | -365 | -386 | -410 | -472 | -512 | -567 |
| 2010 | -464 | -460 | -588 | -659 | -712 | -702 | -682 | -706 | -817 | -942 | -948 | -947 |
| 2011 | -935 | -937 | -939 | -958 | -1,003 | -1,012 | -976 | -1,012 | -1,078 | -1,016 | -1,104 | -1,043 |
| 2012 | -846 | -1,050 | -996 | -1,003 | -1,028 | -1,060 | -1,032 | -961 | -947 | -1,128 | -1,170 | -1,156 |
| 2013 | -1,040 | -1,040 | -1,060 | -1,072 | -1,032 | -1,025 | -1,086 | -1,100 | -1,157 | -1,011 | -1,068 | -1,143 |
| 2014 | -1,087 | -1,062 | -1,103 | -1,023 | -1,019 | -1,009 | -1,016 | -1,073 | -1,164 | -1,154 | -1,181 | -1,211 |
| 2015 | -1,043 | -980 | -1,053 | -1,016 | -1,098 | -1,152 | -1,125 | -1,171 | -1,168 | -1,196 | -1,229 | -1,255 |
| 2016 | -1,275 | -1,178 | -1,041 | -1,051 | -1,072 | -1,176 | -1,100 | -1,088 | -1,122 | -1,060 | -1,188 | -1,274 |
| 2017 | -1,114 | -1,092 | -1,156 | -1,132 | -1,145 | -1,111 | -1,043 | -1,143 | -1,325 | -1,108 | -1,203 | -1,225 |
| 2018 | -1,146 | -1,132 | -1,020 | -1,005 | -1,121 | -1,092 | -995 | -1,130 | -1,181 | -1,208 | -1,316 | -1,266 |
| 2019 | -1,181 | -1,156 | -1,109 | -1,087 | -1,165 | -1,102 | -1,146 | -1,120 | -1,236 | -1,116 | -1,160 | -1,143 |
| 2020 | -1,119 | -1,027 | -1,001 | -763 | -792 | -856 | -935 | -909 | -869 | -840 | -958 | -812 |
| 2021 | -903 | -1,005 | -1,108 | -949 | -1,005 | -1,008 | -1,098 | -1,012 | -832 | -977 | -1,133 | -1,132 |
| 2022 | -1,115 | -1,058 | -1,010 | -981 | -1,034 | -1,011 | -1,064 | -1,025 | -1,163 | -1,071 | -1,175 | -1,119 |
| 2023 | -1,173 | -1,148 | -1,095 | -1,054 | -1,044 | -1,026 | -1,038 | -1,088 | -1,203 | -1,144 | -1,190 | -1,164 |
| 2024 | -1,130 | -1,047 | ||||||||||
| - = No Data Reported; -- = Not Applicable; NA = Not Available; W = Withheld to avoid disclosure of individual company data. |
| Release Date: 4/30/2024 |
| Next Release Date: 5/31/2024 |