|
Download Data (XLS File) |
|
||||||||
|
||||||||
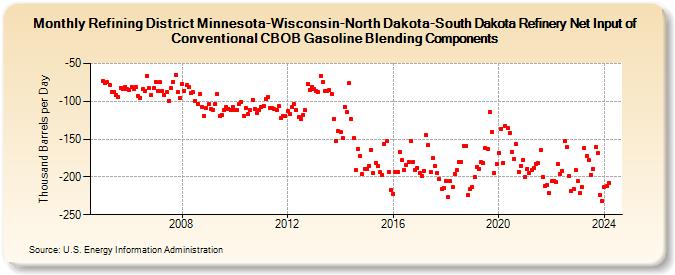
| Refining District Minnesota-Wisconsin-North Dakota-South Dakota Refinery Net Input of Conventional CBOB Gasoline Blending Components (Thousand Barrels per Day) | ||||||||
| Year | Jan | Feb | Mar | Apr | May | Jun | Jul | Aug | Sep | Oct | Nov | Dec |
|---|---|---|---|---|---|---|---|---|---|---|---|---|
| 2005 | -73 | -76 | -75 | -78 | -88 | -88 | -92 | -94 | -82 | -84 | -81 | -84 |
| 2006 | -85 | -81 | -84 | -81 | -93 | -95 | -84 | -86 | -66 | -83 | -92 | -83 |
| 2007 | -74 | -86 | -75 | -86 | -92 | -88 | -99 | -83 | -74 | -65 | -88 | -95 |
| 2008 | -77 | -86 | -79 | -81 | -89 | -88 | -99 | -103 | -91 | -107 | -120 | -109 |
| 2009 | -104 | -110 | -111 | -103 | -90 | -120 | -118 | -112 | -107 | -110 | -112 | -107 |
| 2010 | -112 | -111 | -103 | -101 | -119 | -109 | -117 | -112 | -98 | -110 | -115 | -111 |
| 2011 | -108 | -106 | -97 | -94 | -109 | -109 | -110 | -112 | -106 | -122 | -120 | -120 |
| 2012 | -113 | -117 | -108 | -104 | -112 | -121 | -124 | -118 | -112 | -77 | -85 | -81 |
| 2013 | -84 | -87 | -88 | -66 | -75 | -87 | -86 | -85 | -90 | -123 | -152 | -139 |
| 2014 | -140 | -149 | -107 | -114 | -76 | -124 | -149 | -191 | -163 | -173 | -196 | -189 |
| 2015 | -189 | -185 | -164 | -195 | -181 | -186 | -194 | -197 | -156 | -153 | -193 | -217 |
| 2016 | -222 | -194 | -193 | -167 | -178 | -191 | -184 | -180 | -152 | -180 | -191 | -188 |
| 2017 | -195 | -199 | -192 | -145 | -158 | -193 | -175 | -186 | -195 | -203 | -216 | -215 |
| 2018 | -206 | -227 | -206 | -214 | -196 | -191 | -180 | -180 | -159 | -159 | -224 | -216 |
| 2019 | -214 | -200 | -187 | -189 | -180 | -181 | -162 | -163 | -114 | -141 | -195 | -183 |
| 2020 | -168 | -136 | -181 | -133 | -135 | -142 | -167 | -176 | -157 | -193 | -185 | -177 |
| 2021 | -200 | -189 | -195 | -191 | -188 | -183 | -182 | -165 | -200 | -212 | -211 | -221 |
| 2022 | -206 | -205 | -207 | -183 | -196 | -192 | -153 | -161 | -199 | -218 | -216 | -191 |
| 2023 | -206 | -221 | -214 | -162 | -172 | -178 | -197 | -189 | -161 | -169 | -224 | -232 |
| 2024 | -213 | -212 | ||||||||||
| - = No Data Reported; -- = Not Applicable; NA = Not Available; W = Withheld to avoid disclosure of individual company data. |
| Release Date: 4/30/2024 |
| Next Release Date: 5/31/2024 |