|
Download Data (XLS File) |
|
||||||||
|
||||||||
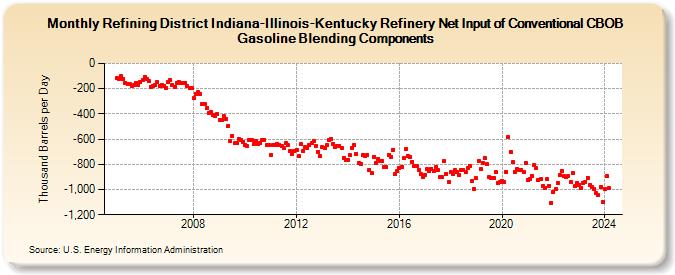
| Refining District Indiana-Illinois-Kentucky Refinery Net Input of Conventional CBOB Gasoline Blending Components (Thousand Barrels per Day) | ||||||||
| Year | Jan | Feb | Mar | Apr | May | Jun | Jul | Aug | Sep | Oct | Nov | Dec |
|---|---|---|---|---|---|---|---|---|---|---|---|---|
| 2005 | -119 | -121 | -103 | -122 | -151 | -160 | -166 | -179 | -172 | -152 | -168 | -150 |
| 2006 | -133 | -105 | -121 | -139 | -186 | -181 | -171 | -148 | -176 | -170 | -175 | -198 |
| 2007 | -150 | -131 | -172 | -185 | -151 | -150 | -157 | -157 | -152 | -182 | -198 | -196 |
| 2008 | -272 | -241 | -230 | -244 | -324 | -324 | -354 | -394 | -383 | -405 | -415 | -400 |
| 2009 | -450 | -446 | -420 | -444 | -496 | -616 | -572 | -632 | -630 | -597 | -609 | -621 |
| 2010 | -645 | -657 | -605 | -610 | -642 | -613 | -636 | -627 | -610 | -604 | -645 | -650 |
| 2011 | -726 | -647 | -649 | -638 | -643 | -653 | -668 | -629 | -649 | -692 | -715 | -691 |
| 2012 | -685 | -732 | -641 | -691 | -665 | -667 | -647 | -629 | -618 | -656 | -699 | -738 |
| 2013 | -665 | -672 | -649 | -604 | -598 | -635 | -663 | -655 | -656 | -667 | -748 | -768 |
| 2014 | -766 | -729 | -670 | -643 | -718 | -789 | -796 | -726 | -737 | -724 | -844 | -868 |
| 2015 | -740 | -789 | -761 | -773 | -770 | -823 | -822 | -724 | -739 | -683 | -877 | -855 |
| 2016 | -829 | -823 | -751 | -680 | -732 | -740 | -779 | -810 | -817 | -846 | -879 | -898 |
| 2017 | -882 | -836 | -856 | -835 | -852 | -820 | -848 | -902 | -904 | -775 | -876 | -940 |
| 2018 | -865 | -878 | -849 | -864 | -883 | -846 | -845 | -865 | -831 | -810 | -930 | -995 |
| 2019 | -912 | -773 | -839 | -791 | -747 | -801 | -902 | -907 | -905 | -863 | -947 | -944 |
| 2020 | -929 | -943 | -861 | -587 | -699 | -785 | -859 | -834 | -845 | -843 | -860 | -788 |
| 2021 | -924 | -916 | -891 | -807 | -830 | -923 | -920 | -973 | -990 | -919 | -970 | -1,107 |
| 2022 | -1,016 | -995 | -949 | -887 | -852 | -893 | -904 | -896 | -939 | -866 | -976 | -947 |
| 2023 | -962 | -987 | -946 | -938 | -906 | -966 | -977 | -995 | -1,029 | -1,047 | -982 | -1,098 |
| 2024 | -999 | -894 | ||||||||||
| - = No Data Reported; -- = Not Applicable; NA = Not Available; W = Withheld to avoid disclosure of individual company data. |
| Release Date: 4/30/2024 |
| Next Release Date: 5/31/2024 |