|
Download Data (XLS File) |
|
||||||||
|
||||||||
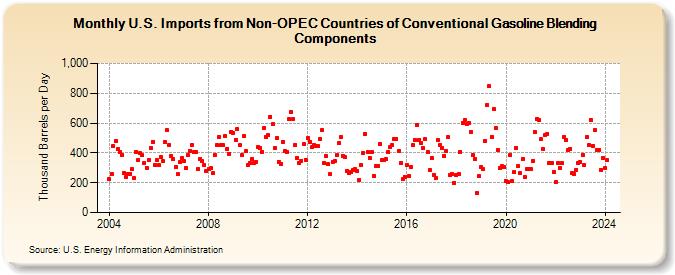
| U.S. Imports from Non-OPEC Countries of Conventional Gasoline Blending Components (Thousand Barrels per Day) | ||||||||
| Year | Jan | Feb | Mar | Apr | May | Jun | Jul | Aug | Sep | Oct | Nov | Dec |
|---|---|---|---|---|---|---|---|---|---|---|---|---|
| 2004 | 223 | 257 | 447 | 480 | 423 | 405 | 388 | 268 | 238 | 262 | 261 | 291 |
| 2005 | 229 | 409 | 355 | 397 | 384 | 331 | 302 | 352 | 432 | 476 | 319 | 351 |
| 2006 | 317 | 370 | 344 | 473 | 552 | 456 | 381 | 358 | 304 | 258 | 337 | 367 |
| 2007 | 345 | 299 | 384 | 413 | 454 | 406 | 407 | 292 | 359 | 343 | 319 | 280 |
| 2008 | 290 | 297 | 263 | 385 | 451 | 509 | 450 | 450 | 514 | 429 | 395 | 543 |
| 2009 | 537 | 489 | 558 | 451 | 383 | 512 | 410 | 316 | 334 | 360 | 331 | 342 |
| 2010 | 438 | 432 | 409 | 569 | 506 | 518 | 644 | 592 | 433 | 499 | 341 | 328 |
| 2011 | 476 | 414 | 408 | 625 | 675 | 630 | 456 | 368 | 331 | 349 | 458 | 355 |
| 2012 | 503 | 476 | 438 | 455 | 447 | 446 | 493 | 553 | 333 | 379 | 325 | 256 |
| 2013 | 340 | 345 | 385 | 467 | 505 | 382 | 371 | 279 | 265 | 269 | 286 | 289 |
| 2014 | 276 | 220 | 317 | 400 | 530 | 407 | 369 | 403 | 247 | 312 | 313 | 460 |
| 2015 | 350 | 353 | 357 | 406 | 441 | 453 | 492 | 494 | 415 | 332 | 225 | 241 |
| 2016 | 321 | 244 | 306 | 453 | 486 | 587 | 490 | 468 | 433 | 491 | 407 | 287 |
| 2017 | 369 | 255 | 235 | 486 | 454 | 436 | 378 | 414 | 504 | 250 | 259 | 201 |
| 2018 | 249 | 260 | 408 | 602 | 621 | 591 | 601 | 542 | 383 | 358 | 128 | 242 |
| 2019 | 306 | 289 | 483 | 723 | 846 | 509 | 696 | 570 | 418 | 298 | 309 | 305 |
| 2020 | 213 | 203 | 389 | 210 | 272 | 434 | 311 | 263 | 358 | 240 | 292 | 290 |
| 2021 | 291 | 348 | 541 | 630 | 620 | 491 | 424 | 520 | 529 | 333 | 330 | 273 |
| 2022 | 203 | 334 | 301 | 330 | 509 | 486 | 417 | 429 | 268 | 257 | 288 | 335 |
| 2023 | 338 | 388 | 320 | 504 | 450 | 624 | 447 | 552 | 418 | 422 | 288 | 368 |
| 2024 | 302 | 350 | 342 | 499 | ||||||||
| - = No Data Reported; -- = Not Applicable; NA = Not Available; W = Withheld to avoid disclosure of individual company data. |
| Release Date: 6/28/2024 |
| Next Release Date: 7/31/2024 |