|
Download Data (XLS File) |
|
||||||||
|
||||||||
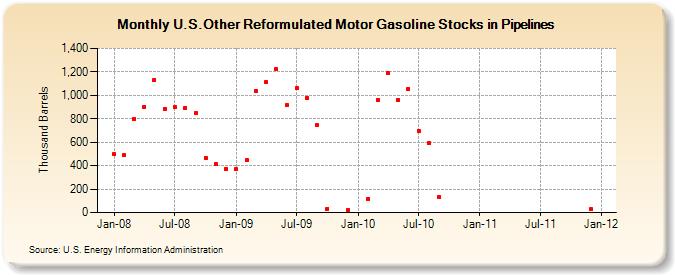
| U.S.Other Reformulated Motor Gasoline Stocks in Pipelines (Thousand Barrels) | ||||||||
| Year | Jan | Feb | Mar | Apr | May | Jun | Jul | Aug | Sep | Oct | Nov | Dec |
|---|---|---|---|---|---|---|---|---|---|---|---|---|
| 2008 | 496 | 488 | 801 | 904 | 1,133 | 887 | 897 | 894 | 851 | 469 | 412 | 374 |
| 2009 | 369 | 444 | 1,037 | 1,115 | 1,221 | 917 | 1,063 | 980 | 743 | 34 | 19 | |
| 2010 | 116 | 960 | 1,189 | 963 | 1,055 | 697 | 591 | 132 | ||||
| 2011 | 27 | |||||||||||
| - = No Data Reported; -- = Not Applicable; NA = Not Available; W = Withheld to avoid disclosure of individual company data. |
| Release Date: 3/29/2024 |
| Next Release Date: 4/30/2024 |