|
Download Data (XLS File) |
|
||||||||
|
||||||||
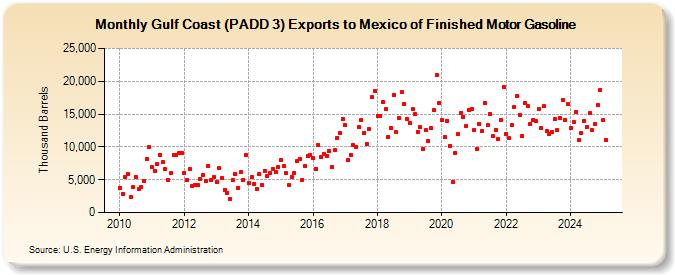
| Gulf Coast (PADD 3) Exports to Mexico of Finished Motor Gasoline (Thousand Barrels) | ||||||||
| Year | Jan | Feb | Mar | Apr | May | Jun | Jul | Aug | Sep | Oct | Nov | Dec |
|---|---|---|---|---|---|---|---|---|---|---|---|---|
| 2010 | 3,760 | 2,891 | 5,367 | 5,918 | 2,387 | 3,877 | 5,453 | 3,583 | 3,933 | 4,820 | 8,105 | 9,948 |
| 2011 | 6,868 | 6,378 | 7,349 | 8,756 | 7,693 | 6,590 | 4,928 | 6,005 | 8,690 | 8,716 | 9,037 | 9,091 |
| 2012 | 6,058 | 4,902 | 6,581 | 4,065 | 4,182 | 4,261 | 5,071 | 5,755 | 4,850 | 7,133 | 4,890 | 5,385 |
| 2013 | 4,646 | 6,744 | 5,304 | 3,440 | 3,044 | 2,081 | 4,883 | 5,819 | 3,740 | 6,126 | 5,023 | 8,789 |
| 2014 | 4,469 | 5,356 | 4,421 | 3,653 | 5,835 | 4,241 | 6,365 | 5,592 | 5,977 | 6,658 | 6,115 | 6,939 |
| 2015 | 7,986 | 7,152 | 5,966 | 4,219 | 5,460 | 6,046 | 7,832 | 8,222 | 5,029 | 7,084 | 8,587 | 8,824 |
| 2016 | 8,268 | 6,667 | 10,288 | 8,394 | 8,974 | 8,680 | 9,410 | 6,954 | 9,555 | 11,388 | 12,130 | 14,299 |
| 2017 | 13,271 | 7,972 | 8,804 | 10,262 | 10,031 | 13,006 | 14,094 | 12,158 | 10,440 | 12,680 | 17,543 | 18,580 |
| 2018 | 14,721 | 14,754 | 16,791 | 15,712 | 11,545 | 12,847 | 17,926 | 12,237 | 14,363 | 18,308 | 16,530 | 14,184 |
| 2019 | 13,701 | 15,746 | 14,961 | 12,326 | 13,064 | 9,743 | 12,511 | 10,973 | 12,835 | 15,610 | 20,993 | 16,758 |
| 2020 | 14,034 | 11,471 | 13,962 | 10,158 | 4,614 | 9,062 | 11,968 | 15,192 | 14,617 | 13,199 | 15,574 | 15,779 |
| 2021 | 12,549 | 9,609 | 13,557 | 12,449 | 16,693 | 13,260 | 15,022 | 11,692 | 12,574 | 11,160 | 14,041 | 19,052 |
| 2022 | 11,999 | 11,310 | 13,282 | 16,030 | 17,765 | 14,881 | 11,693 | 16,680 | 16,164 | 13,485 | 14,119 | 13,970 |
| 2023 | 14,357 | 13,732 | 16,612 | 11,780 | 12,260 | 12,600 | 14,203 | 12,442 | 14,551 | 17,122 | 14,109 | 16,201 |
| 2024 | 12,950 | 13,750 | 15,294 | 11,042 | ||||||||
| - = No Data Reported; -- = Not Applicable; NA = Not Available; W = Withheld to avoid disclosure of individual company data. |
| Release Date: 6/28/2024 |
| Next Release Date: 7/31/2024 |