|
Download Data (XLS File) |
|
||||||||
|
||||||||
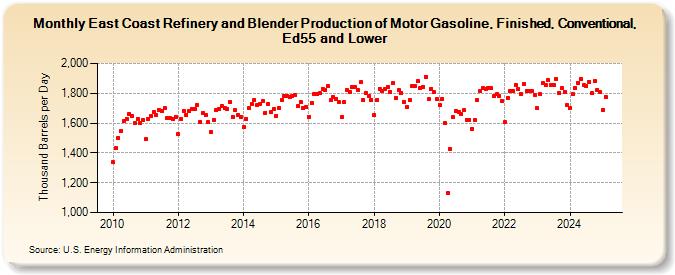
| East Coast Refinery and Blender Production of Motor Gasoline, Finished, Conventional, Ed55 and Lower (Thousand Barrels per Day) | ||||||||
| Year | Jan | Feb | Mar | Apr | May | Jun | Jul | Aug | Sep | Oct | Nov | Dec |
|---|---|---|---|---|---|---|---|---|---|---|---|---|
| 2010 | 1,337 | 1,431 | 1,501 | 1,550 | 1,613 | 1,628 | 1,662 | 1,647 | 1,599 | 1,626 | 1,598 | 1,622 |
| 2011 | 1,493 | 1,628 | 1,649 | 1,674 | 1,656 | 1,691 | 1,681 | 1,703 | 1,633 | 1,634 | 1,630 | 1,643 |
| 2012 | 1,524 | 1,628 | 1,682 | 1,657 | 1,679 | 1,698 | 1,693 | 1,720 | 1,609 | 1,669 | 1,656 | 1,605 |
| 2013 | 1,539 | 1,624 | 1,688 | 1,693 | 1,715 | 1,699 | 1,696 | 1,742 | 1,643 | 1,686 | 1,653 | 1,642 |
| 2014 | 1,571 | 1,628 | 1,702 | 1,727 | 1,755 | 1,723 | 1,726 | 1,747 | 1,671 | 1,730 | 1,674 | 1,698 |
| 2015 | 1,648 | 1,700 | 1,756 | 1,782 | 1,782 | 1,776 | 1,784 | 1,789 | 1,713 | 1,743 | 1,700 | 1,709 |
| 2016 | 1,643 | 1,733 | 1,794 | 1,795 | 1,800 | 1,830 | 1,824 | 1,847 | 1,753 | 1,775 | 1,765 | 1,744 |
| 2017 | 1,640 | 1,739 | 1,823 | 1,812 | 1,841 | 1,840 | 1,823 | 1,873 | 1,755 | 1,804 | 1,779 | 1,756 |
| 2018 | 1,653 | 1,754 | 1,831 | 1,817 | 1,828 | 1,842 | 1,808 | 1,866 | 1,767 | 1,820 | 1,803 | 1,742 |
| 2019 | 1,711 | 1,754 | 1,846 | 1,849 | 1,880 | 1,836 | 1,845 | 1,911 | 1,760 | 1,832 | 1,806 | 1,759 |
| 2020 | 1,723 | 1,764 | 1,602 | 1,130 | 1,425 | 1,639 | 1,678 | 1,673 | 1,662 | 1,686 | 1,624 | 1,624 |
| 2021 | 1,562 | 1,618 | 1,758 | 1,816 | 1,835 | 1,831 | 1,835 | 1,834 | 1,779 | 1,792 | 1,784 | 1,751 |
| 2022 | 1,605 | 1,771 | 1,816 | 1,815 | 1,855 | 1,828 | 1,798 | 1,860 | 1,818 | 1,818 | 1,813 | 1,790 |
| 2023 | 1,695 | 1,788 | 1,861 | 1,848 | 1,881 | 1,858 | 1,853 | 1,896 | 1,801 | 1,835 | 1,810 | 1,721 |
| 2024 | 1,700 | |||||||||||
| - = No Data Reported; -- = Not Applicable; NA = Not Available; W = Withheld to avoid disclosure of individual company data. |
| Release Date: 3/29/2024 |
| Next Release Date: 4/30/2024 |