|
Download Data (XLS File) |
|
||||||||
|
||||||||
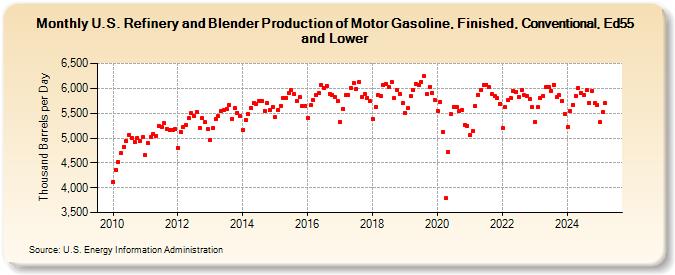
| U.S. Refinery and Blender Production of Motor Gasoline, Finished, Conventional, Ed55 and Lower (Thousand Barrels per Day) | ||||||||
| Year | Jan | Feb | Mar | Apr | May | Jun | Jul | Aug | Sep | Oct | Nov | Dec |
|---|---|---|---|---|---|---|---|---|---|---|---|---|
| 2010 | 4,112 | 4,358 | 4,513 | 4,694 | 4,823 | 4,937 | 5,067 | 5,007 | 4,925 | 4,999 | 4,944 | 5,018 |
| 2011 | 4,649 | 4,892 | 5,012 | 5,085 | 5,049 | 5,245 | 5,218 | 5,293 | 5,187 | 5,157 | 5,160 | 5,175 |
| 2012 | 4,800 | 5,126 | 5,225 | 5,267 | 5,393 | 5,495 | 5,434 | 5,520 | 5,208 | 5,401 | 5,322 | 5,179 |
| 2013 | 4,964 | 5,196 | 5,383 | 5,435 | 5,539 | 5,564 | 5,581 | 5,660 | 5,387 | 5,600 | 5,513 | 5,438 |
| 2014 | 5,163 | 5,367 | 5,480 | 5,609 | 5,714 | 5,693 | 5,747 | 5,753 | 5,550 | 5,700 | 5,559 | 5,621 |
| 2015 | 5,413 | 5,565 | 5,653 | 5,799 | 5,812 | 5,899 | 5,959 | 5,884 | 5,754 | 5,823 | 5,637 | 5,653 |
| 2016 | 5,403 | 5,657 | 5,762 | 5,856 | 5,903 | 6,060 | 6,012 | 6,046 | 5,891 | 5,862 | 5,818 | 5,748 |
| 2017 | 5,332 | 5,593 | 5,856 | 5,870 | 6,004 | 6,099 | 5,990 | 6,131 | 5,827 | 5,881 | 5,814 | 5,737 |
| 2018 | 5,389 | 5,627 | 5,862 | 5,838 | 6,063 | 6,090 | 6,019 | 6,131 | 5,800 | 5,976 | 5,887 | 5,698 |
| 2019 | 5,498 | 5,597 | 5,840 | 5,964 | 6,091 | 6,058 | 6,136 | 6,243 | 5,883 | 6,035 | 5,902 | 5,764 |
| 2020 | 5,550 | 5,726 | 5,122 | 3,787 | 4,728 | 5,476 | 5,629 | 5,622 | 5,544 | 5,573 | 5,258 | 5,244 |
| 2021 | 5,058 | 5,136 | 5,651 | 5,872 | 5,970 | 6,072 | 6,077 | 6,017 | 5,885 | 5,838 | 5,798 | 5,694 |
| 2022 | 5,199 | 5,615 | 5,758 | 5,803 | 5,952 | 5,931 | 5,827 | 5,963 | 5,858 | 5,836 | 5,779 | 5,615 |
| 2023 | 5,326 | 5,617 | 5,800 | 5,840 | 6,015 | 6,036 | 5,953 | 6,074 | 5,822 | 5,859 | 5,740 | 5,476 |
| 2024 | 5,212 | |||||||||||
| - = No Data Reported; -- = Not Applicable; NA = Not Available; W = Withheld to avoid disclosure of individual company data. |
| Release Date: 3/29/2024 |
| Next Release Date: 4/30/2024 |