|
Download Data (XLS File) |
|
||||||||
|
||||||||
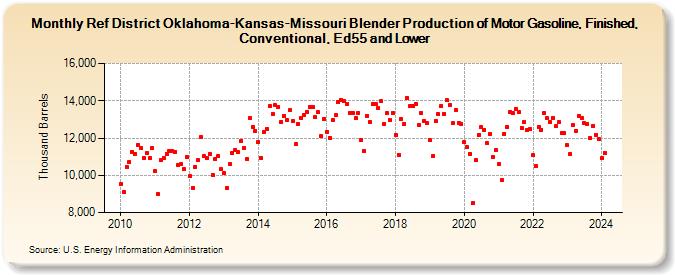
| Ref District Oklahoma-Kansas-Missouri Blender Production of Motor Gasoline, Finished, Conventional, Ed55 and Lower (Thousand Barrels) | ||||||||
| Year | Jan | Feb | Mar | Apr | May | Jun | Jul | Aug | Sep | Oct | Nov | Dec |
|---|---|---|---|---|---|---|---|---|---|---|---|---|
| 2010 | 9,549 | 9,113 | 10,457 | 10,717 | 11,271 | 11,147 | 11,630 | 11,466 | 10,943 | 11,185 | 10,904 | 11,464 |
| 2011 | 10,208 | 8,987 | 10,827 | 10,948 | 11,159 | 11,303 | 11,313 | 11,265 | 10,541 | 10,603 | 10,321 | 10,987 |
| 2012 | 9,945 | 9,341 | 10,465 | 10,816 | 12,048 | 11,021 | 10,909 | 11,152 | 10,041 | 10,860 | 11,012 | 10,312 |
| 2013 | 10,109 | 9,336 | 10,586 | 11,213 | 11,349 | 11,256 | 11,843 | 11,465 | 10,871 | 13,067 | 12,587 | 12,391 |
| 2014 | 11,785 | 10,940 | 12,315 | 12,502 | 13,718 | 13,297 | 13,746 | 13,668 | 12,864 | 13,199 | 12,959 | 13,477 |
| 2015 | 12,903 | 11,664 | 12,753 | 13,059 | 13,241 | 13,387 | 13,676 | 13,642 | 13,107 | 13,377 | 12,105 | 13,035 |
| 2016 | 12,323 | 12,019 | 12,974 | 13,216 | 13,913 | 14,066 | 13,971 | 13,837 | 13,355 | 13,319 | 13,052 | 13,347 |
| 2017 | 11,896 | 11,310 | 13,198 | 12,866 | 13,825 | 13,814 | 13,614 | 13,969 | 12,759 | 13,318 | 12,948 | 13,343 |
| 2018 | 12,176 | 11,110 | 12,999 | 12,770 | 14,166 | 13,697 | 13,743 | 13,832 | 12,691 | 13,348 | 12,924 | 12,792 |
| 2019 | 11,879 | 11,019 | 12,916 | 13,268 | 13,713 | 13,290 | 14,015 | 13,771 | 12,788 | 13,509 | 12,830 | 12,755 |
| 2020 | 11,771 | 11,517 | 11,165 | 8,502 | 10,794 | 12,178 | 12,572 | 12,456 | 11,707 | 12,237 | 10,991 | 11,352 |
| 2021 | 10,592 | 9,729 | 12,230 | 12,586 | 13,399 | 13,318 | 13,533 | 13,419 | 12,561 | 12,848 | 12,427 | 12,481 |
| 2022 | 11,064 | 10,477 | 12,594 | 12,448 | 13,352 | 13,053 | 12,854 | 13,087 | 12,619 | 12,837 | 12,264 | 12,243 |
| 2023 | 11,603 | 11,145 | 12,677 | 12,400 | 13,191 | 13,094 | 12,804 | 12,777 | 11,997 | 12,646 | 12,187 | 11,943 |
| 2024 | 10,925 | |||||||||||
| - = No Data Reported; -- = Not Applicable; NA = Not Available; W = Withheld to avoid disclosure of individual company data. |
| Release Date: 3/29/2024 |
| Next Release Date: 4/30/2024 |