|
Download Data (XLS File) |
|
||||||||
|
||||||||
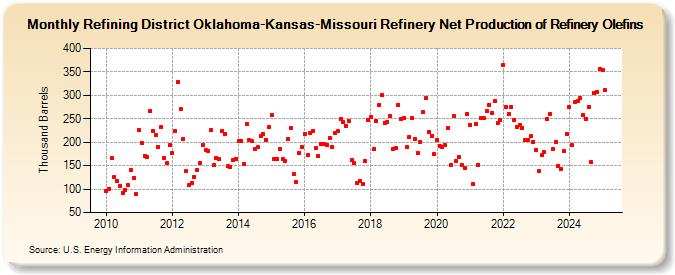
| Refining District Oklahoma-Kansas-Missouri Refinery Net Production of Refinery Olefins (Thousand Barrels) | ||||||||
| Year | Jan | Feb | Mar | Apr | May | Jun | Jul | Aug | Sep | Oct | Nov | Dec |
|---|---|---|---|---|---|---|---|---|---|---|---|---|
| 2010 | 96 | 101 | 166 | 126 | 117 | 107 | 92 | 98 | 108 | 141 | 124 | 90 |
| 2011 | 226 | 198 | 171 | 168 | 267 | 224 | 215 | 190 | 232 | 166 | 155 | 193 |
| 2012 | 176 | 223 | 329 | 270 | 207 | 138 | 108 | 113 | 126 | 141 | 156 | 195 |
| 2013 | 183 | 182 | 225 | 151 | 167 | 164 | 224 | 218 | 149 | 148 | 162 | 164 |
| 2014 | 202 | 203 | 153 | 238 | 204 | 202 | 185 | 189 | 213 | 218 | 204 | 233 |
| 2015 | 259 | 165 | 164 | 186 | 164 | 160 | 207 | 230 | 132 | 115 | 178 | 189 |
| 2016 | 218 | 173 | 219 | 224 | 188 | 170 | 197 | 197 | 193 | 209 | 190 | 219 |
| 2017 | 223 | 249 | 244 | 235 | 246 | 161 | 155 | 114 | 117 | 110 | 159 | 248 |
| 2018 | 253 | 185 | 245 | 280 | 300 | 242 | 244 | 256 | 185 | 187 | 280 | 249 |
| 2019 | 251 | 189 | 211 | 252 | 206 | 177 | 201 | 265 | 294 | 222 | 213 | 175 |
| 2020 | 204 | 192 | 189 | 193 | 230 | 152 | 255 | 159 | 168 | 152 | 145 | 261 |
| 2021 | 237 | 111 | 239 | 152 | 252 | 251 | 266 | 279 | 262 | 287 | 240 | 247 |
| 2022 | 365 | 276 | 261 | 276 | 248 | 233 | 236 | 230 | 205 | 205 | 213 | 200 |
| 2023 | 184 | 138 | 172 | 179 | 250 | 261 | 185 | 201 | 150 | 143 | 181 | 217 |
| 2024 | 274 | |||||||||||
| - = No Data Reported; -- = Not Applicable; NA = Not Available; W = Withheld to avoid disclosure of individual company data. |
| Release Date: 3/29/2024 |
| Next Release Date: 4/30/2024 |