|
Download Data (XLS File) |
|
||||||||
|
||||||||
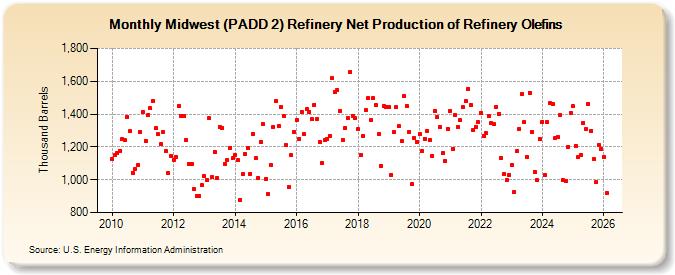
| Midwest (PADD 2) Refinery Net Production of Refinery Olefins (Thousand Barrels) | ||||||||
| Year | Jan | Feb | Mar | Apr | May | Jun | Jul | Aug | Sep | Oct | Nov | Dec |
|---|---|---|---|---|---|---|---|---|---|---|---|---|
| 2010 | 1,125 | 1,150 | 1,164 | 1,178 | 1,247 | 1,240 | 1,383 | 1,295 | 1,044 | 1,066 | 1,091 | 1,291 |
| 2011 | 1,414 | 1,235 | 1,393 | 1,434 | 1,479 | 1,313 | 1,278 | 1,215 | 1,288 | 1,176 | 1,042 | 1,144 |
| 2012 | 1,120 | 1,141 | 1,448 | 1,390 | 1,387 | 1,243 | 1,095 | 1,095 | 944 | 900 | 900 | 965 |
| 2013 | 1,020 | 996 | 1,374 | 1,016 | 1,169 | 1,009 | 1,324 | 1,315 | 1,097 | 1,120 | 1,195 | 1,130 |
| 2014 | 1,152 | 1,119 | 879 | 1,032 | 1,158 | 1,191 | 1,037 | 1,280 | 1,130 | 1,011 | 1,229 | 1,339 |
| 2015 | 1,007 | 912 | 1,087 | 1,324 | 1,479 | 1,328 | 1,443 | 1,389 | 1,210 | 956 | 1,150 | 1,293 |
| 2016 | 1,363 | 1,250 | 1,413 | 1,276 | 1,430 | 1,413 | 1,367 | 1,457 | 1,370 | 1,232 | 1,103 | 1,243 |
| 2017 | 1,251 | 1,268 | 1,617 | 1,534 | 1,546 | 1,419 | 1,242 | 1,316 | 1,378 | 1,659 | 1,390 | 1,373 |
| 2018 | 1,307 | 1,153 | 1,267 | 1,423 | 1,497 | 1,365 | 1,495 | 1,456 | 1,276 | 1,085 | 1,449 | 1,442 |
| 2019 | 1,440 | 1,031 | 1,290 | 1,441 | 1,325 | 1,233 | 1,509 | 1,449 | 1,292 | 972 | 1,254 | 1,232 |
| 2020 | 1,277 | 1,175 | 1,250 | 1,299 | 1,243 | 1,147 | 1,421 | 1,381 | 1,322 | 1,162 | 1,113 | 1,310 |
| 2021 | 1,420 | 1,188 | 1,394 | 1,322 | 1,362 | 1,440 | 1,477 | 1,555 | 1,457 | 1,304 | 1,324 | 1,350 |
| 2022 | 1,409 | 1,267 | 1,283 | 1,389 | 1,343 | 1,340 | 1,444 | 1,403 | 1,134 | 1,032 | 997 | 1,030 |
| 2023 | 1,089 | 928 | 1,174 | 1,312 | 1,523 | 1,353 | 1,137 | 1,531 | 1,291 | 1,049 | 996 | 1,249 |
| 2024 | 1,353 | |||||||||||
| - = No Data Reported; -- = Not Applicable; NA = Not Available; W = Withheld to avoid disclosure of individual company data. |
| Release Date: 3/29/2024 |
| Next Release Date: 4/30/2024 |