|
Download Data (XLS File) |
|
||||||||
|
||||||||
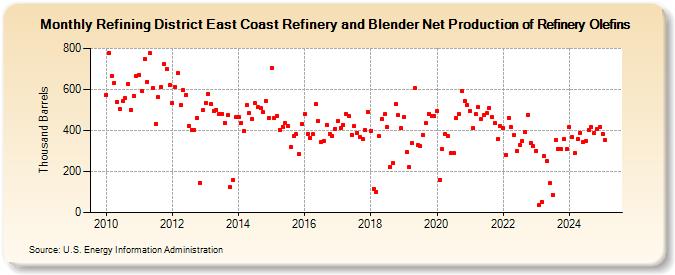
| Refining District East Coast Refinery and Blender Net Production of Refinery Olefins (Thousand Barrels) | ||||||||
| Year | Jan | Feb | Mar | Apr | May | Jun | Jul | Aug | Sep | Oct | Nov | Dec |
|---|---|---|---|---|---|---|---|---|---|---|---|---|
| 2010 | 574 | 778 | 667 | 633 | 539 | 506 | 544 | 558 | 627 | 499 | 570 | 664 |
| 2011 | 671 | 591 | 746 | 638 | 776 | 606 | 432 | 563 | 613 | 723 | 699 | 620 |
| 2012 | 534 | 614 | 678 | 522 | 597 | 573 | 422 | 403 | 404 | 462 | 146 | 498 |
| 2013 | 536 | 580 | 531 | 495 | 502 | 478 | 481 | 438 | 475 | 124 | 159 | 464 |
| 2014 | 465 | 437 | 397 | 523 | 483 | 457 | 532 | 513 | 508 | 488 | 544 | 463 |
| 2015 | 706 | 461 | 471 | 400 | 419 | 434 | 421 | 321 | 372 | 381 | 283 | 431 |
| 2016 | 480 | 384 | 363 | 381 | 527 | 446 | 346 | 351 | 427 | 385 | 375 | 409 |
| 2017 | 445 | 412 | 429 | 482 | 472 | 380 | 420 | 388 | 366 | 359 | 400 | 492 |
| 2018 | 398 | 117 | 102 | 372 | 457 | 479 | 415 | 224 | 240 | 529 | 473 | 410 |
| 2019 | 466 | 293 | 220 | 339 | 605 | 328 | 322 | 378 | 434 | 481 | 472 | 471 |
| 2020 | 493 | 161 | 309 | 382 | 373 | 290 | 288 | 460 | 478 | 593 | 543 | 525 |
| 2021 | 493 | 414 | 478 | 514 | 456 | 475 | 483 | 511 | 466 | 436 | 358 | 420 |
| 2022 | 411 | 282 | 463 | 415 | 377 | 298 | 329 | 349 | 391 | 477 | 340 | 322 |
| 2023 | 300 | 36 | 53 | 274 | 251 | 140 | 88 | 353 | 310 | 310 | 358 | 308 |
| 2024 | 418 | |||||||||||
| - = No Data Reported; -- = Not Applicable; NA = Not Available; W = Withheld to avoid disclosure of individual company data. |
| Release Date: 3/29/2024 |
| Next Release Date: 4/30/2024 |