|
Download Data (XLS File) |
|
||||||||
|
||||||||
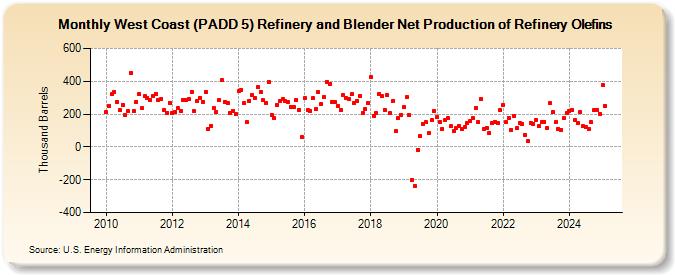
| West Coast (PADD 5) Refinery and Blender Net Production of Refinery Olefins (Thousand Barrels) | ||||||||
| Year | Jan | Feb | Mar | Apr | May | Jun | Jul | Aug | Sep | Oct | Nov | Dec |
|---|---|---|---|---|---|---|---|---|---|---|---|---|
| 2010 | 211 | 250 | 320 | 335 | 274 | 224 | 257 | 192 | 216 | 452 | 219 | 274 |
| 2011 | 322 | 234 | 310 | 298 | 284 | 313 | 324 | 283 | 294 | 226 | 209 | 268 |
| 2012 | 205 | 215 | 235 | 217 | 286 | 283 | 293 | 337 | 216 | 282 | 300 | 276 |
| 2013 | 337 | 108 | 130 | 238 | 210 | 286 | 405 | 276 | 266 | 204 | 221 | 198 |
| 2014 | 338 | 347 | 267 | 149 | 282 | 317 | 299 | 365 | 337 | 283 | 266 | 398 |
| 2015 | 197 | 175 | 257 | 280 | 289 | 278 | 273 | 246 | 241 | 287 | 226 | 58 |
| 2016 | 296 | 223 | 221 | 295 | 228 | 334 | 262 | 305 | 398 | 381 | 272 | 272 |
| 2017 | 248 | 224 | 315 | 298 | 292 | 320 | 269 | 281 | 311 | 204 | 229 | 266 |
| 2018 | 424 | 191 | 204 | 323 | 307 | 227 | 314 | 204 | 281 | 95 | 179 | 197 |
| 2019 | 242 | 302 | 193 | -202 | -238 | -17 | 66 | 140 | 150 | 82 | 162 | 221 |
| 2020 | 181 | 154 | 109 | 163 | 173 | 125 | 95 | 113 | 125 | 108 | 121 | 147 |
| 2021 | 157 | 176 | 237 | 153 | 290 | 109 | 116 | 84 | 148 | 154 | 148 | 224 |
| 2022 | 256 | 149 | 176 | 103 | 191 | 115 | 147 | 140 | 73 | 34 | 147 | 141 |
| 2023 | 164 | 130 | 153 | 154 | 117 | 265 | 211 | 150 | 111 | 104 | 173 | 205 |
| 2024 | 218 | 227 | 161 | 146 | ||||||||
| - = No Data Reported; -- = Not Applicable; NA = Not Available; W = Withheld to avoid disclosure of individual company data. |
| Release Date: 6/28/2024 |
| Next Release Date: 7/31/2024 |