|
Download Data (XLS File) |
|
||||||||
|
||||||||
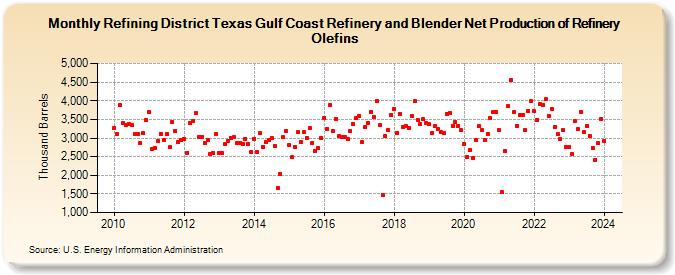
| Refining District Texas Gulf Coast Refinery and Blender Net Production of Refinery Olefins (Thousand Barrels) | ||||||||
| Year | Jan | Feb | Mar | Apr | May | Jun | Jul | Aug | Sep | Oct | Nov | Dec |
|---|---|---|---|---|---|---|---|---|---|---|---|---|
| 2010 | 3,261 | 3,108 | 3,896 | 3,400 | 3,336 | 3,377 | 3,357 | 3,114 | 3,104 | 2,868 | 3,122 | 3,489 |
| 2011 | 3,695 | 2,702 | 2,736 | 2,930 | 3,110 | 2,935 | 3,099 | 2,757 | 3,441 | 3,190 | 2,893 | 2,950 |
| 2012 | 2,980 | 2,603 | 3,399 | 3,464 | 3,674 | 3,037 | 3,036 | 2,858 | 2,953 | 2,574 | 2,592 | 3,108 |
| 2013 | 2,593 | 2,594 | 2,827 | 2,931 | 3,012 | 3,018 | 2,859 | 2,879 | 2,839 | 2,978 | 2,832 | 2,638 |
| 2014 | 2,982 | 2,630 | 3,129 | 2,770 | 2,896 | 2,944 | 3,001 | 2,786 | 1,665 | 2,043 | 3,016 | 3,179 |
| 2015 | 2,802 | 2,486 | 2,762 | 3,158 | 2,892 | 3,153 | 3,006 | 3,267 | 2,879 | 2,660 | 2,738 | 3,010 |
| 2016 | 3,550 | 3,254 | 3,880 | 3,182 | 3,518 | 3,049 | 3,023 | 3,024 | 2,961 | 3,175 | 3,387 | 3,530 |
| 2017 | 3,597 | 2,884 | 3,292 | 3,411 | 3,705 | 3,573 | 3,999 | 3,346 | 1,479 | 3,064 | 3,220 | 3,609 |
| 2018 | 3,791 | 3,131 | 3,653 | 3,307 | 3,325 | 3,263 | 3,591 | 3,984 | 3,490 | 3,367 | 3,500 | 3,396 |
| 2019 | 3,364 | 3,146 | 3,312 | 3,236 | 3,160 | 3,144 | 3,645 | 3,672 | 3,333 | 3,421 | 3,317 | 3,214 |
| 2020 | 2,830 | 2,503 | 2,675 | 2,451 | 2,936 | 3,311 | 3,214 | 2,944 | 3,104 | 3,525 | 3,706 | 3,701 |
| 2021 | 3,207 | 1,540 | 2,656 | 3,865 | 4,560 | 3,694 | 3,334 | 3,613 | 3,620 | 3,228 | 3,732 | 3,984 |
| 2022 | 3,717 | 3,491 | 3,904 | 3,896 | 4,039 | 3,596 | 3,792 | 3,299 | 3,103 | 2,962 | 3,223 | 2,767 |
| 2023 | 2,762 | 2,577 | 3,457 | 3,239 | 3,702 | 3,152 | 3,329 | 3,051 | 2,737 | 2,417 | 2,859 | 3,513 |
| 2024 | 2,922 | |||||||||||
| - = No Data Reported; -- = Not Applicable; NA = Not Available; W = Withheld to avoid disclosure of individual company data. |
| Release Date: 3/29/2024 |
| Next Release Date: 4/30/2024 |