|
Download Data (XLS File) |
|
||||||||
|
||||||||
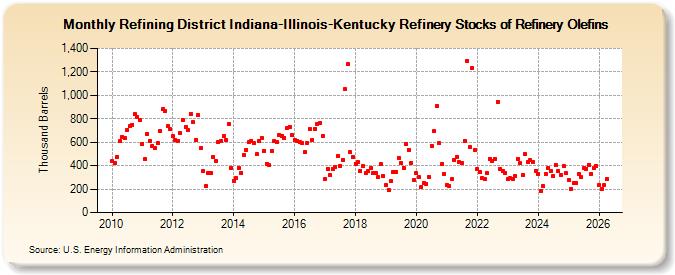
| Refining District Indiana-Illinois-Kentucky Refinery Stocks of Refinery Olefins (Thousand Barrels) | ||||||||
| Year | Jan | Feb | Mar | Apr | May | Jun | Jul | Aug | Sep | Oct | Nov | Dec |
|---|---|---|---|---|---|---|---|---|---|---|---|---|
| 2010 | 437 | 419 | 478 | 608 | 647 | 634 | 708 | 734 | 750 | 838 | 816 | 793 |
| 2011 | 588 | 458 | 670 | 613 | 568 | 549 | 589 | 695 | 880 | 865 | 734 | 710 |
| 2012 | 649 | 622 | 613 | 680 | 788 | 730 | 702 | 844 | 769 | 617 | 834 | 547 |
| 2013 | 353 | 227 | 339 | 337 | 476 | 443 | 602 | 611 | 649 | 619 | 757 | 380 |
| 2014 | 272 | 293 | 378 | 341 | 495 | 536 | 600 | 613 | 592 | 496 | 609 | 640 |
| 2015 | 529 | 418 | 403 | 528 | 610 | 599 | 661 | 657 | 638 | 721 | 733 | 659 |
| 2016 | 623 | 614 | 599 | 592 | 518 | 596 | 712 | 621 | 714 | 757 | 763 | 657 |
| 2017 | 288 | 375 | 318 | 374 | 389 | 482 | 401 | 451 | 1,051 | 1,264 | 513 | 478 |
| 2018 | 417 | 428 | 355 | 397 | 336 | 351 | 376 | 341 | 339 | 302 | 413 | 313 |
| 2019 | 232 | 191 | 266 | 348 | 348 | 467 | 421 | 384 | 585 | 536 | 423 | 274 |
| 2020 | 337 | 299 | 222 | 251 | 246 | 306 | 571 | 693 | 909 | 590 | 413 | 332 |
| 2021 | 238 | 227 | 282 | 446 | 474 | 428 | 424 | 614 | 1,295 | 561 | 1,231 | 535 |
| 2022 | 373 | 344 | 293 | 283 | 334 | 461 | 441 | 461 | 947 | 373 | 351 | 337 |
| 2023 | 287 | 291 | 285 | 315 | 460 | 419 | 320 | 497 | 431 | 444 | 432 | 356 |
| 2024 | 329 | |||||||||||
| - = No Data Reported; -- = Not Applicable; NA = Not Available; W = Withheld to avoid disclosure of individual company data. |
| Release Date: 3/29/2024 |
| Next Release Date: 4/30/2024 |