|
Download Data (XLS File) |
|
||||||||
|
||||||||
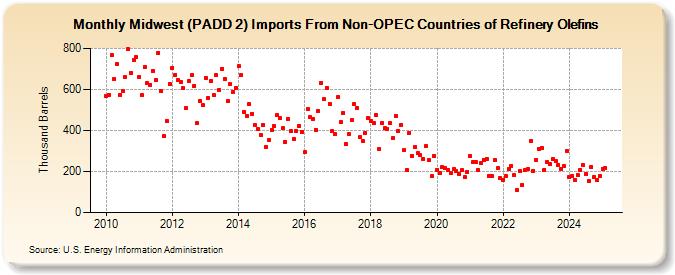
| Midwest (PADD 2) Imports From Non-OPEC Countries of Refinery Olefins (Thousand Barrels) | ||||||||
| Year | Jan | Feb | Mar | Apr | May | Jun | Jul | Aug | Sep | Oct | Nov | Dec |
|---|---|---|---|---|---|---|---|---|---|---|---|---|
| 2010 | 567 | 575 | 766 | 651 | 724 | 573 | 593 | 659 | 797 | 682 | 745 | 756 |
| 2011 | 661 | 574 | 709 | 630 | 623 | 690 | 646 | 779 | 591 | 373 | 447 | 628 |
| 2012 | 706 | 671 | 647 | 638 | 605 | 508 | 640 | 668 | 618 | 436 | 542 | 522 |
| 2013 | 658 | 560 | 642 | 571 | 671 | 598 | 701 | 651 | 543 | 625 | 589 | 607 |
| 2014 | 712 | 670 | 489 | 470 | 527 | 482 | 426 | 408 | 377 | 426 | 321 | 352 |
| 2015 | 402 | 421 | 476 | 462 | 410 | 346 | 456 | 397 | 359 | 396 | 424 | 395 |
| 2016 | 293 | 505 | 464 | 458 | 404 | 495 | 633 | 551 | 609 | 531 | 397 | 383 |
| 2017 | 564 | 440 | 487 | 335 | 381 | 453 | 529 | 510 | 366 | 349 | 390 | 460 |
| 2018 | 445 | 435 | 474 | 309 | 436 | 411 | 408 | 437 | 363 | 472 | 397 | 429 |
| 2019 | 303 | 208 | 389 | 277 | 321 | 288 | 280 | 261 | 323 | 255 | 176 | 278 |
| 2020 | 209 | 195 | 222 | 215 | 209 | 193 | 211 | 202 | 189 | 205 | 171 | 199 |
| 2021 | 275 | 245 | 244 | 207 | 242 | 258 | 263 | 176 | 176 | 256 | 216 | 168 |
| 2022 | 161 | 179 | 212 | 229 | 182 | 108 | 201 | 135 | 208 | 210 | 350 | 204 |
| 2023 | 233 | 310 | 316 | 209 | 245 | 235 | 262 | 252 | 232 | 213 | 226 | 300 |
| 2024 | 173 | 179 | 160 | 181 | ||||||||
| - = No Data Reported; -- = Not Applicable; NA = Not Available; W = Withheld to avoid disclosure of individual company data. |
| Release Date: 6/28/2024 |
| Next Release Date: 7/31/2024 |