|
Download Data (XLS File) |
|
||||||||
|
||||||||
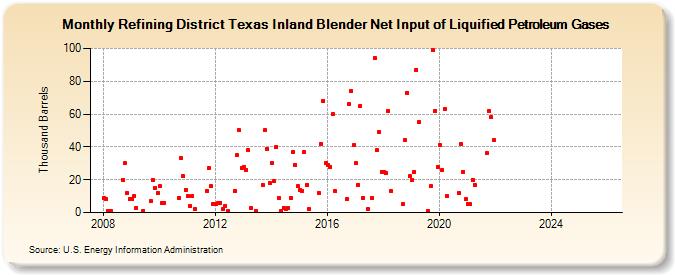
| Refining District Texas Inland Blender Net Input of Liquified Petroleum Gases (Thousand Barrels) | ||||||||
| Year | Jan | Feb | Mar | Apr | May | Jun | Jul | Aug | Sep | Oct | Nov | Dec |
|---|---|---|---|---|---|---|---|---|---|---|---|---|
| 2008 | 9 | 8 | 1 | 1 | 20 | 30 | 12 | 8 | ||||
| 2009 | 8 | 10 | 3 | 1 | 7 | 20 | 15 | 12 | ||||
| 2010 | 16 | 6 | 6 | 9 | 33 | 22 | 14 | |||||
| 2011 | 10 | 4 | 10 | 2 | 13 | 27 | 16 | 5 | ||||
| 2012 | 5 | 6 | 6 | 2 | 4 | 1 | 13 | 35 | 50 | 27 | ||
| 2013 | 28 | 26 | 38 | 3 | 1 | 17 | 50 | 39 | 18 | |||
| 2014 | 30 | 19 | 40 | 9 | 1 | 3 | 2 | 3 | 9 | 37 | 29 | 16 |
| 2015 | 14 | 13 | 37 | 17 | 2 | 12 | 42 | 68 | 30 | |||
| 2016 | 29 | 28 | 60 | 13 | 8 | 66 | 74 | 41 | ||||
| 2017 | 30 | 17 | 65 | 9 | 2 | 9 | 94 | 38 | 49 | 25 | ||
| 2018 | 25 | 24 | 62 | 13 | 5 | 44 | 73 | 22 | ||||
| 2019 | 20 | 25 | 87 | 55 | 1 | 16 | 99 | 62 | 28 | |||
| 2020 | 41 | 26 | 63 | 10 | 12 | 42 | 25 | 8 | ||||
| 2021 | 5 | 5 | 20 | 17 | 36 | 62 | 58 | 44 | ||||
| 2022 | -- | -- | -- | -- | -- | -- | -- | -- | ||||
| 2023 | -- | -- | -- | -- | -- | -- | -- | -- | -- | |||
| 2024 | -- | |||||||||||
| - = No Data Reported; -- = Not Applicable; NA = Not Available; W = Withheld to avoid disclosure of individual company data. |
| Release Date: 3/29/2024 |
| Next Release Date: 4/30/2024 |