|
Download Data (XLS File) |
|
||||||||
|
||||||||
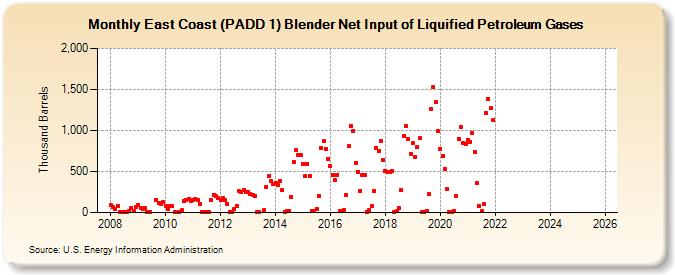
| East Coast (PADD 1) Blender Net Input of Liquified Petroleum Gases (Thousand Barrels) | ||||||||
| Year | Jan | Feb | Mar | Apr | May | Jun | Jul | Aug | Sep | Oct | Nov | Dec |
|---|---|---|---|---|---|---|---|---|---|---|---|---|
| 2008 | 92 | 67 | 48 | 85 | 1 | 3 | 1 | 11 | 22 | 61 | 23 | 73 |
| 2009 | 93 | 54 | 40 | 54 | 1 | 3 | 153 | 120 | 105 | 125 | ||
| 2010 | 78 | 42 | 80 | 77 | 5 | 1 | 28 | 135 | 159 | 165 | 145 | |
| 2011 | 156 | 171 | 150 | 103 | 2 | 1 | 1 | 2 | 147 | 220 | 196 | 179 |
| 2012 | 158 | 176 | 147 | 100 | 7 | 3 | 43 | 84 | 262 | 254 | 271 | 256 |
| 2013 | 250 | 225 | 214 | 203 | 3 | 2 | 32 | 313 | 440 | 383 | 343 | |
| 2014 | 360 | 339 | 387 | 274 | 12 | 24 | 19 | 192 | 612 | 761 | 697 | 701 |
| 2015 | 593 | 441 | 595 | 449 | 20 | 21 | 45 | 198 | 781 | 866 | 772 | 647 |
| 2016 | 572 | 463 | 393 | 462 | 15 | 21 | 30 | 217 | 814 | 1,060 | 999 | 608 |
| 2017 | 499 | 266 | 457 | 457 | 10 | 30 | 75 | 266 | 790 | 754 | 871 | 645 |
| 2018 | 511 | 493 | 492 | 509 | 8 | 13 | 58 | 270 | 930 | 1,055 | 898 | 717 |
| 2019 | 842 | 671 | 798 | 908 | 4 | 11 | 18 | 222 | 1,260 | 1,524 | 1,348 | 988 |
| 2020 | 778 | 689 | 534 | 281 | 5 | 3 | 19 | 199 | 899 | 1,047 | 846 | 841 |
| 2021 | 879 | 863 | 975 | 741 | 363 | 83 | 18 | 104 | 1,217 | 1,386 | 1,274 | 1,129 |
| 2022 | -- | -- | -- | -- | -- | -- | -- | -- | -- | -- | -- | -- |
| 2023 | -- | -- | -- | -- | -- | -- | -- | -- | -- | -- | -- | -- |
| 2024 | -- | |||||||||||
| - = No Data Reported; -- = Not Applicable; NA = Not Available; W = Withheld to avoid disclosure of individual company data. |
| Release Date: 3/29/2024 |
| Next Release Date: 4/30/2024 |
Referring Pages: