|
Download Data (XLS File) |
|
||||||||
|
||||||||
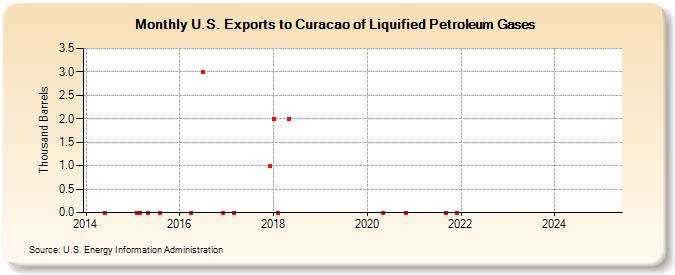
| U.S. Exports to Curacao of Liquified Petroleum Gases (Thousand Barrels) | ||||||||
| Year | Jan | Feb | Mar | Apr | May | Jun | Jul | Aug | Sep | Oct | Nov | Dec |
|---|---|---|---|---|---|---|---|---|---|---|---|---|
| 2014 | 0 | |||||||||||
| 2015 | 0 | 0 | 0 | 0 | ||||||||
| 2016 | 0 | 3 | 0 | |||||||||
| 2017 | 0 | 1 | ||||||||||
| 2018 | 2 | 0 | 2 | |||||||||
| 2020 | 0 | 0 | ||||||||||
| 2021 | 0 | 0 | ||||||||||
| 2022 | -- | -- | -- | -- | -- | |||||||
| 2024 | -- | |||||||||||
| - = No Data Reported; -- = Not Applicable; NA = Not Available; W = Withheld to avoid disclosure of individual company data. |
| Release Date: 6/28/2024 |
| Next Release Date: 7/31/2024 |