|
Download Data (XLS File) |
|
||||||||
|
||||||||
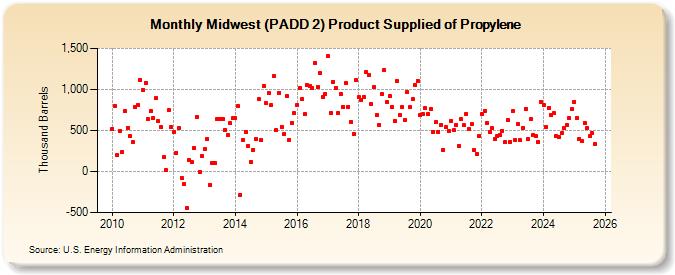
| Midwest (PADD 2) Product Supplied of Propylene (Thousand Barrels) | ||||||||
| Year | Jan | Feb | Mar | Apr | May | Jun | Jul | Aug | Sep | Oct | Nov | Dec |
|---|---|---|---|---|---|---|---|---|---|---|---|---|
| 2010 | 520 | 797 | 199 | 495 | 241 | 734 | 535 | 434 | 358 | 785 | 813 | 1,118 |
| 2011 | 998 | 1,084 | 637 | 737 | 654 | 892 | 611 | 543 | 175 | 13 | 744 | 540 |
| 2012 | 487 | 231 | 530 | -74 | -157 | -439 | 135 | 113 | 292 | 667 | -5 | 190 |
| 2013 | 270 | 395 | -161 | 108 | 100 | 643 | 643 | 638 | 511 | 444 | 587 | 646 |
| 2014 | 655 | 795 | -283 | 379 | 485 | 316 | 116 | 266 | 391 | 883 | 390 | 1,043 |
| 2015 | 831 | 955 | 808 | 1,158 | 505 | 962 | 546 | 457 | 920 | 386 | 596 | 709 |
| 2016 | 812 | 1,016 | 885 | 695 | 1,051 | 1,046 | 1,016 | 1,327 | 1,034 | 1,203 | 910 | 947 |
| 2017 | 1,405 | 714 | 1,096 | 1,022 | 708 | 947 | 786 | 1,078 | 790 | 604 | 459 | 1,110 |
| 2018 | 904 | 866 | 910 | 1,213 | 1,176 | 820 | 1,028 | 687 | 570 | 949 | 1,232 | 846 |
| 2019 | 916 | 780 | 618 | 1,098 | 688 | 787 | 626 | 970 | 784 | 881 | 1,057 | 1,107 |
| 2020 | 693 | 695 | 772 | 699 | 760 | 482 | 598 | 485 | 568 | 263 | 541 | 497 |
| 2021 | 613 | 503 | 569 | 316 | 634 | 561 | 703 | 519 | 575 | 266 | 211 | 437 |
| 2022 | 700 | 735 | 590 | 481 | 528 | 398 | 427 | 445 | 499 | 354 | 625 | 364 |
| 2023 | 764 | 377 | 567 | 383 | 531 | 764 | 395 | 636 | 448 | 429 | 359 | 867 |
| 2024 | 883 | |||||||||||
| - = No Data Reported; -- = Not Applicable; NA = Not Available; W = Withheld to avoid disclosure of individual company data. |
| Release Date: 3/29/2024 |
| Next Release Date: 4/30/2024 |