|
Download Data (XLS File) |
|
||||||||
|
||||||||
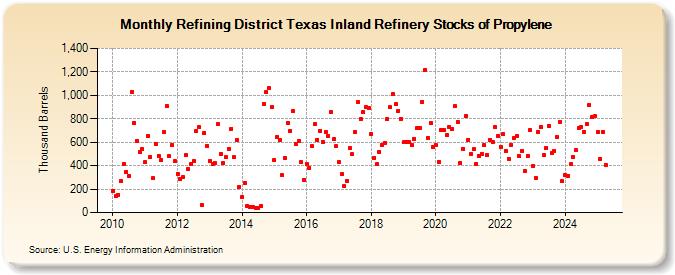
| Refining District Texas Inland Refinery Stocks of Propylene (Thousand Barrels) | ||||||||
| Year | Jan | Feb | Mar | Apr | May | Jun | Jul | Aug | Sep | Oct | Nov | Dec |
|---|---|---|---|---|---|---|---|---|---|---|---|---|
| 2010 | 183 | 139 | 152 | 266 | 417 | 349 | 314 | 1,028 | 765 | 612 | 517 | 540 |
| 2011 | 431 | 657 | 472 | 292 | 587 | 485 | 450 | 684 | 908 | 482 | 580 | 437 |
| 2012 | 331 | 282 | 302 | 489 | 374 | 410 | 436 | 694 | 729 | 64 | 682 | 570 |
| 2013 | 440 | 415 | 420 | 752 | 501 | 421 | 470 | 545 | 715 | 470 | 623 | 216 |
| 2014 | 132 | 256 | 58 | 44 | 50 | 38 | 38 | 56 | 927 | 1,029 | 1,059 | 900 |
| 2015 | 448 | 645 | 618 | 318 | 467 | 763 | 696 | 863 | 581 | 609 | 429 | 278 |
| 2016 | 412 | 380 | 566 | 751 | 622 | 698 | 605 | 685 | 649 | 857 | 626 | 564 |
| 2017 | 429 | 328 | 226 | 273 | 547 | 496 | 687 | 941 | 797 | 859 | 900 | 889 |
| 2018 | 670 | 468 | 410 | 519 | 580 | 594 | 797 | 898 | 1,008 | 922 | 869 | 799 |
| 2019 | 599 | 604 | 601 | 578 | 631 | 723 | 718 | 945 | 1,216 | 634 | 767 | 559 |
| 2020 | 573 | 434 | 704 | 702 | 658 | 731 | 716 | 905 | 775 | 423 | 546 | 822 |
| 2021 | 621 | 499 | 538 | 415 | 484 | 502 | 575 | 489 | 622 | 602 | 726 | 655 |
| 2022 | 563 | 669 | 529 | 461 | 579 | 638 | 650 | 479 | 529 | 357 | 484 | 704 |
| 2023 | 399 | 298 | 690 | 732 | 487 | 554 | 741 | 510 | 528 | 643 | 775 | 269 |
| 2024 | 323 | |||||||||||
| - = No Data Reported; -- = Not Applicable; NA = Not Available; W = Withheld to avoid disclosure of individual company data. |
| Release Date: 3/29/2024 |
| Next Release Date: 4/30/2024 |
Referring Pages: