|
Download Data (XLS File) |
|
||||||||
|
||||||||
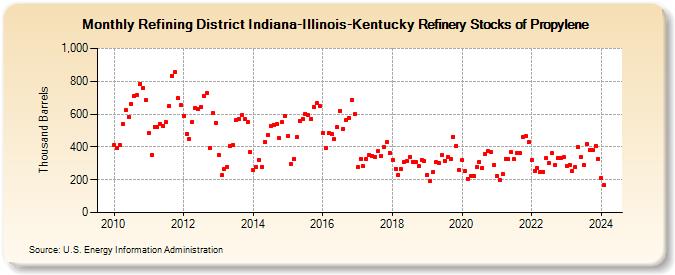
| Refining District Indiana-Illinois-Kentucky Refinery Stocks of Propylene (Thousand Barrels) | ||||||||
| Year | Jan | Feb | Mar | Apr | May | Jun | Jul | Aug | Sep | Oct | Nov | Dec |
|---|---|---|---|---|---|---|---|---|---|---|---|---|
| 2010 | 411 | 391 | 414 | 541 | 622 | 585 | 663 | 707 | 714 | 786 | 761 | 685 |
| 2011 | 486 | 350 | 524 | 523 | 538 | 526 | 550 | 649 | 834 | 855 | 696 | 653 |
| 2012 | 591 | 477 | 450 | 553 | 637 | 632 | 646 | 712 | 727 | 395 | 604 | 546 |
| 2013 | 353 | 227 | 266 | 279 | 407 | 414 | 562 | 567 | 594 | 569 | 550 | 368 |
| 2014 | 257 | 276 | 321 | 279 | 430 | 473 | 527 | 536 | 538 | 454 | 549 | 586 |
| 2015 | 464 | 297 | 329 | 460 | 559 | 570 | 602 | 593 | 570 | 645 | 665 | 649 |
| 2016 | 483 | 395 | 483 | 478 | 447 | 519 | 621 | 512 | 563 | 578 | 687 | 600 |
| 2017 | 276 | 329 | 281 | 328 | 349 | 344 | 340 | 372 | 347 | 398 | 427 | 363 |
| 2018 | 322 | 268 | 230 | 265 | 308 | 313 | 340 | 311 | 307 | 281 | 323 | 313 |
| 2019 | 231 | 191 | 245 | 305 | 302 | 349 | 317 | 337 | 329 | 462 | 406 | 260 |
| 2020 | 318 | 251 | 205 | 222 | 222 | 275 | 309 | 273 | 356 | 372 | 370 | 290 |
| 2021 | 223 | 196 | 236 | 329 | 325 | 367 | 324 | 360 | 361 | 463 | 466 | 428 |
| 2022 | 323 | 255 | 271 | 250 | 250 | 333 | 302 | 361 | 289 | 333 | 333 | 336 |
| 2023 | 283 | 291 | 254 | 277 | 400 | 338 | 288 | 417 | 383 | 379 | 404 | 325 |
| 2024 | 212 | |||||||||||
| - = No Data Reported; -- = Not Applicable; NA = Not Available; W = Withheld to avoid disclosure of individual company data. |
| Release Date: 3/29/2024 |
| Next Release Date: 4/30/2024 |