|
Download Data (XLS File) |
|
||||||||
|
||||||||
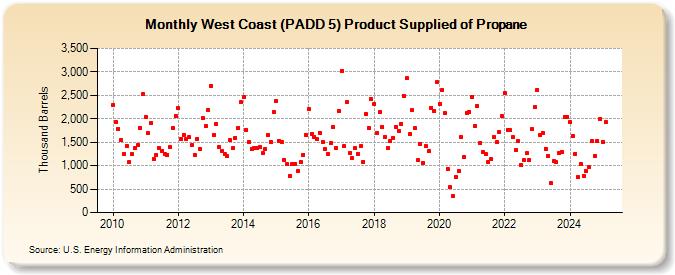
| West Coast (PADD 5) Product Supplied of Propane (Thousand Barrels) | ||||||||
| Year | Jan | Feb | Mar | Apr | May | Jun | Jul | Aug | Sep | Oct | Nov | Dec |
|---|---|---|---|---|---|---|---|---|---|---|---|---|
| 2010 | 2,296 | 1,926 | 1,790 | 1,542 | 1,258 | 1,415 | 1,075 | 1,242 | 1,368 | 1,435 | 1,809 | 2,525 |
| 2011 | 2,041 | 1,696 | 1,905 | 1,146 | 1,222 | 1,379 | 1,323 | 1,256 | 1,230 | 1,397 | 1,806 | 2,062 |
| 2012 | 2,229 | 1,571 | 1,657 | 1,578 | 1,609 | 1,432 | 1,233 | 1,572 | 1,364 | 2,013 | 1,845 | 2,192 |
| 2013 | 2,696 | 1,661 | 1,883 | 1,403 | 1,314 | 1,241 | 1,200 | 1,539 | 1,370 | 1,596 | 1,811 | 2,347 |
| 2014 | 2,456 | 1,759 | 1,512 | 1,352 | 1,376 | 1,368 | 1,408 | 1,268 | 1,347 | 1,656 | 1,506 | 2,145 |
| 2015 | 2,382 | 1,526 | 1,510 | 1,125 | 1,029 | 789 | 1,034 | 1,036 | 891 | 1,080 | 1,235 | 1,656 |
| 2016 | 2,208 | 1,683 | 1,617 | 1,560 | 1,702 | 1,506 | 1,354 | 1,252 | 1,476 | 1,826 | 1,385 | 2,169 |
| 2017 | 3,027 | 1,417 | 2,347 | 1,275 | 1,159 | 1,384 | 1,258 | 1,424 | 1,088 | 2,102 | 1,806 | 2,416 |
| 2018 | 2,318 | 1,700 | 2,141 | 1,830 | 1,612 | 1,370 | 1,530 | 1,597 | 1,830 | 1,749 | 1,890 | 2,491 |
| 2019 | 2,860 | 1,669 | 2,180 | 1,799 | 1,116 | 1,467 | 1,065 | 1,414 | 1,302 | 2,235 | 2,159 | 2,777 |
| 2020 | 2,319 | 2,617 | 2,115 | 929 | 538 | 346 | 768 | 884 | 1,604 | 1,175 | 2,124 | 2,146 |
| 2021 | 2,464 | 1,841 | 2,269 | 1,483 | 1,290 | 1,239 | 1,069 | 1,132 | 1,608 | 1,497 | 1,717 | 2,051 |
| 2022 | 2,539 | 1,761 | 1,752 | 1,601 | 1,330 | 1,527 | 1,010 | 1,118 | 1,260 | 1,130 | 1,779 | 2,249 |
| 2023 | 2,614 | 1,733 | 1,700 | 1,160 | 1,349 | 621 | 1,093 | 1,070 | 1,276 | 1,265 | 2,043 | 2,042 |
| 2024 | 2,016 | |||||||||||
| - = No Data Reported; -- = Not Applicable; NA = Not Available; W = Withheld to avoid disclosure of individual company data. |
| Release Date: 3/29/2024 |
| Next Release Date: 4/30/2024 |