|
Download Data (XLS File) |
|
||||||||
|
||||||||
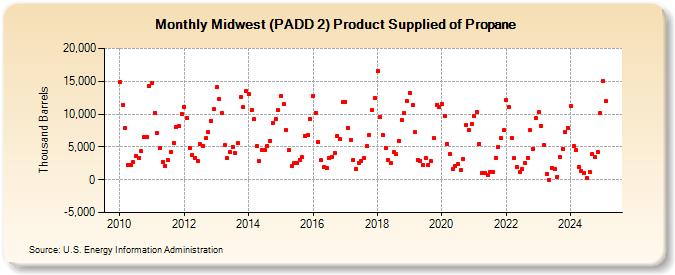
| Midwest (PADD 2) Product Supplied of Propane (Thousand Barrels) | ||||||||
| Year | Jan | Feb | Mar | Apr | May | Jun | Jul | Aug | Sep | Oct | Nov | Dec |
|---|---|---|---|---|---|---|---|---|---|---|---|---|
| 2010 | 14,910 | 11,311 | 7,827 | 2,229 | 2,254 | 2,656 | 3,590 | 3,318 | 4,315 | 6,561 | 6,518 | 14,266 |
| 2011 | 14,755 | 10,227 | 7,089 | 4,808 | 2,748 | 2,145 | 3,053 | 4,275 | 5,668 | 8,029 | 8,165 | 10,029 |
| 2012 | 11,131 | 9,431 | 4,895 | 3,737 | 3,372 | 2,922 | 5,382 | 5,196 | 6,315 | 7,212 | 8,988 | 10,719 |
| 2013 | 14,065 | 12,315 | 10,107 | 5,238 | 3,234 | 4,180 | 5,018 | 4,051 | 5,575 | 12,654 | 11,056 | 13,449 |
| 2014 | 13,047 | 10,689 | 9,207 | 5,094 | 2,821 | 4,582 | 4,536 | 5,124 | 5,933 | 8,581 | 9,249 | 10,618 |
| 2015 | 12,684 | 11,552 | 7,539 | 4,499 | 2,053 | 2,482 | 2,611 | 3,058 | 3,395 | 6,733 | 6,753 | 9,300 |
| 2016 | 12,826 | 10,237 | 5,751 | 2,961 | 1,890 | 1,726 | 3,297 | 3,519 | 4,073 | 6,682 | 6,203 | 11,785 |
| 2017 | 11,888 | 7,880 | 6,055 | 2,988 | 1,655 | 2,512 | 2,853 | 3,286 | 5,119 | 6,828 | 10,575 | 12,412 |
| 2018 | 16,541 | 9,532 | 6,833 | 4,836 | 3,018 | 2,486 | 4,168 | 3,847 | 5,932 | 9,146 | 10,104 | 11,937 |
| 2019 | 13,250 | 11,373 | 7,211 | 3,064 | 2,852 | 2,225 | 3,335 | 2,270 | 2,812 | 6,387 | 11,438 | 11,026 |
| 2020 | 11,550 | 9,700 | 5,437 | 3,977 | 1,561 | 2,016 | 2,339 | 1,456 | 3,211 | 8,269 | 7,544 | 8,472 |
| 2021 | 9,651 | 10,353 | 5,509 | 1,000 | 1,025 | 724 | 1,177 | 1,227 | 3,311 | 5,008 | 6,290 | 7,560 |
| 2022 | 12,082 | 11,028 | 6,402 | 3,264 | 2,012 | 1,121 | 1,706 | 2,501 | 3,366 | 7,522 | 4,742 | 9,361 |
| 2023 | 10,410 | 8,050 | 7,004 | 2,111 | 185 | 2,236 | 1,724 | 805 | 3,340 | 4,796 | 7,484 | 9,096 |
| 2024 | 11,076 | |||||||||||
| - = No Data Reported; -- = Not Applicable; NA = Not Available; W = Withheld to avoid disclosure of individual company data. |
| Release Date: 3/29/2024 |
| Next Release Date: 4/30/2024 |