|
Download Data (XLS File) |
|
||||||||
|
||||||||
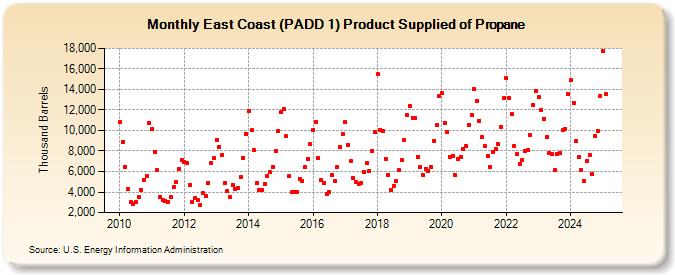
| East Coast (PADD 1) Product Supplied of Propane (Thousand Barrels) | ||||||||
| Year | Jan | Feb | Mar | Apr | May | Jun | Jul | Aug | Sep | Oct | Nov | Dec |
|---|---|---|---|---|---|---|---|---|---|---|---|---|
| 2010 | 10,796 | 8,911 | 6,449 | 4,326 | 3,054 | 2,868 | 2,990 | 3,492 | 4,197 | 5,139 | 5,574 | 10,760 |
| 2011 | 10,139 | 7,854 | 6,101 | 3,563 | 3,231 | 3,130 | 3,031 | 3,491 | 4,477 | 4,971 | 6,259 | 7,155 |
| 2012 | 6,956 | 6,840 | 4,727 | 3,070 | 3,399 | 3,182 | 2,741 | 3,868 | 3,622 | 4,872 | 6,822 | 7,332 |
| 2013 | 9,101 | 8,422 | 7,629 | 4,912 | 4,087 | 3,520 | 4,692 | 4,248 | 4,440 | 5,478 | 7,336 | 9,635 |
| 2014 | 11,898 | 10,024 | 8,083 | 4,874 | 4,231 | 4,192 | 4,818 | 5,589 | 5,922 | 6,468 | 7,980 | 9,947 |
| 2015 | 11,763 | 12,097 | 9,439 | 5,561 | 3,967 | 4,028 | 4,007 | 5,315 | 5,057 | 6,462 | 7,225 | 8,639 |
| 2016 | 10,089 | 10,860 | 7,269 | 5,195 | 4,905 | 3,792 | 3,962 | 5,633 | 5,071 | 6,489 | 8,351 | 9,674 |
| 2017 | 10,791 | 8,549 | 6,982 | 5,380 | 4,988 | 4,809 | 4,837 | 5,956 | 6,869 | 6,079 | 8,007 | 9,837 |
| 2018 | 15,474 | 10,051 | 9,938 | 7,266 | 5,683 | 4,206 | 4,579 | 5,075 | 6,116 | 7,111 | 9,044 | 11,474 |
| 2019 | 12,424 | 11,258 | 11,208 | 7,461 | 6,422 | 5,673 | 6,281 | 6,067 | 6,419 | 8,975 | 10,493 | 13,316 |
| 2020 | 13,614 | 10,763 | 9,845 | 7,457 | 7,542 | 5,669 | 7,223 | 7,392 | 8,232 | 8,508 | 10,570 | 11,517 |
| 2021 | 14,085 | 12,866 | 10,960 | 9,323 | 8,517 | 7,514 | 6,464 | 7,946 | 8,208 | 8,636 | 10,374 | 13,181 |
| 2022 | 15,066 | 13,171 | 11,586 | 8,439 | 7,675 | 6,774 | 7,161 | 8,044 | 8,125 | 9,522 | 12,506 | 13,819 |
| 2023 | 13,149 | 11,947 | 9,678 | 8,117 | 7,930 | 8,233 | 5,369 | 8,231 | 7,564 | 10,031 | 10,176 | 11,600 |
| 2024 | 14,969 | |||||||||||
| - = No Data Reported; -- = Not Applicable; NA = Not Available; W = Withheld to avoid disclosure of individual company data. |
| Release Date: 3/29/2024 |
| Next Release Date: 4/30/2024 |