|
Download Data (XLS File) |
|
||||||||
|
||||||||
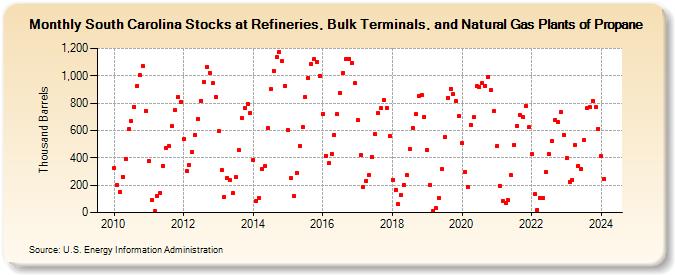
| South Carolina Stocks at Refineries, Bulk Terminals, and Natural Gas Plants of Propane (Thousand Barrels) | ||||||||
| Year | Jan | Feb | Mar | Apr | May | Jun | Jul | Aug | Sep | Oct | Nov | Dec |
|---|---|---|---|---|---|---|---|---|---|---|---|---|
| 2010 | 327 | 202 | 151 | 262 | 395 | 610 | 671 | 775 | 928 | 1,002 | 1,071 | 746 |
| 2011 | 375 | 91 | 8 | 123 | 146 | 340 | 472 | 483 | 630 | 748 | 843 | 808 |
| 2012 | 535 | 304 | 349 | 442 | 569 | 684 | 819 | 955 | 1,066 | 1,022 | 944 | 844 |
| 2013 | 593 | 314 | 115 | 253 | 236 | 140 | 261 | 456 | 694 | 767 | 796 | 729 |
| 2014 | 385 | 82 | 109 | 320 | 340 | 615 | 900 | 1,037 | 1,135 | 1,172 | 1,105 | 926 |
| 2015 | 603 | 250 | 120 | 292 | 488 | 623 | 846 | 987 | 1,086 | 1,119 | 1,104 | 1,000 |
| 2016 | 721 | 417 | 359 | 431 | 569 | 717 | 877 | 1,023 | 1,121 | 1,126 | 1,091 | 946 |
| 2017 | 678 | 418 | 186 | 232 | 276 | 405 | 574 | 727 | 761 | 822 | 765 | 560 |
| 2018 | 240 | 168 | 60 | 130 | 202 | 271 | 464 | 619 | 720 | 851 | 860 | 701 |
| 2019 | 458 | 202 | 11 | 30 | 110 | 315 | 550 | 840 | 905 | 864 | 814 | 709 |
| 2020 | 506 | 298 | 190 | 642 | 696 | 924 | 917 | 944 | 926 | 992 | 894 | 740 |
| 2021 | 485 | 197 | 86 | 72 | 89 | 272 | 497 | 633 | 710 | 696 | 780 | 622 |
| 2022 | 427 | 133 | 22 | 106 | 108 | 295 | 425 | 520 | 673 | 664 | 736 | 569 |
| 2023 | 400 | 227 | 238 | 495 | 343 | 321 | 531 | 762 | 768 | 819 | 768 | 613 |
| 2024 | 410 | |||||||||||
| - = No Data Reported; -- = Not Applicable; NA = Not Available; W = Withheld to avoid disclosure of individual company data. |
| Release Date: 3/29/2024 |
| Next Release Date: 4/30/2024 |