|
Download Data (XLS File) |
|
||||||||
|
||||||||
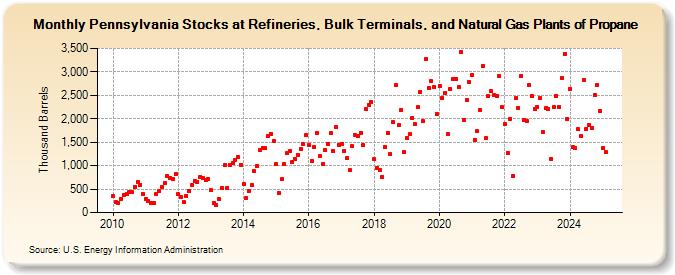
| Pennsylvania Stocks at Refineries, Bulk Terminals, and Natural Gas Plants of Propane (Thousand Barrels) | ||||||||
| Year | Jan | Feb | Mar | Apr | May | Jun | Jul | Aug | Sep | Oct | Nov | Dec |
|---|---|---|---|---|---|---|---|---|---|---|---|---|
| 2010 | 344 | 219 | 205 | 295 | 376 | 396 | 432 | 429 | 553 | 653 | 596 | 405 |
| 2011 | 296 | 251 | 197 | 195 | 406 | 450 | 548 | 640 | 781 | 738 | 711 | 813 |
| 2012 | 386 | 336 | 221 | 354 | 449 | 585 | 682 | 654 | 768 | 740 | 699 | 708 |
| 2013 | 475 | 212 | 157 | 281 | 531 | 1,007 | 523 | 1,024 | 1,046 | 1,126 | 1,179 | 1,024 |
| 2014 | 614 | 313 | 459 | 584 | 876 | 988 | 1,329 | 1,375 | 1,367 | 1,630 | 1,685 | 1,532 |
| 2015 | 1,028 | 412 | 710 | 1,032 | 1,261 | 1,302 | 1,069 | 1,146 | 1,236 | 1,350 | 1,453 | 1,647 |
| 2016 | 1,437 | 1,107 | 1,392 | 1,692 | 1,204 | 1,025 | 1,333 | 1,463 | 1,695 | 1,308 | 1,817 | 1,442 |
| 2017 | 1,467 | 1,313 | 1,159 | 898 | 1,417 | 1,646 | 1,639 | 1,702 | 1,431 | 2,203 | 2,302 | 2,356 |
| 2018 | 1,135 | 950 | 902 | 766 | 1,388 | 1,706 | 1,246 | 1,928 | 2,714 | 1,858 | 2,193 | 1,289 |
| 2019 | 1,597 | 1,669 | 2,024 | 1,885 | 2,241 | 2,578 | 1,943 | 3,275 | 2,653 | 2,798 | 2,673 | 2,105 |
| 2020 | 2,697 | 2,437 | 2,540 | 1,673 | 2,636 | 2,853 | 2,858 | 2,681 | 3,423 | 1,975 | 2,409 | 2,783 |
| 2021 | 2,931 | 1,553 | 1,729 | 2,185 | 3,129 | 1,579 | 2,476 | 2,584 | 2,502 | 2,487 | 2,901 | 2,241 |
| 2022 | 1,881 | 1,277 | 2,005 | 786 | 2,445 | 2,232 | 2,903 | 1,979 | 1,955 | 2,728 | 2,480 | 2,214 |
| 2023 | 2,258 | 2,434 | 2,100 | 2,223 | 2,213 | 1,143 | 2,822 | 2,489 | 2,242 | 2,877 | 3,385 | 1,999 |
| 2024 | 2,640 | |||||||||||
| - = No Data Reported; -- = Not Applicable; NA = Not Available; W = Withheld to avoid disclosure of individual company data. |
| Release Date: 3/29/2024 |
| Next Release Date: 4/30/2024 |