|
Download Data (XLS File) |
|
||||||||
|
||||||||
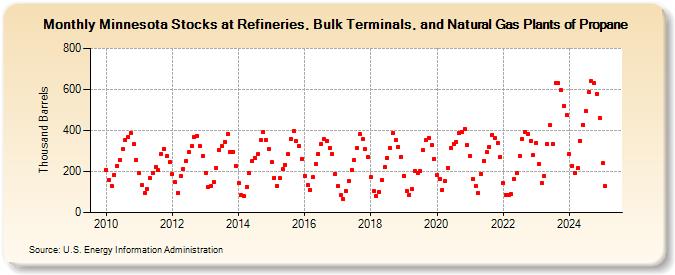
| Minnesota Stocks at Refineries, Bulk Terminals, and Natural Gas Plants of Propane (Thousand Barrels) | ||||||||
| Year | Jan | Feb | Mar | Apr | May | Jun | Jul | Aug | Sep | Oct | Nov | Dec |
|---|---|---|---|---|---|---|---|---|---|---|---|---|
| 2010 | 208 | 161 | 131 | 182 | 227 | 257 | 308 | 352 | 367 | 390 | 332 | 257 |
| 2011 | 193 | 134 | 95 | 116 | 168 | 193 | 223 | 206 | 285 | 312 | 275 | 244 |
| 2012 | 189 | 147 | 97 | 179 | 213 | 252 | 294 | 322 | 367 | 375 | 322 | 278 |
| 2013 | 195 | 123 | 129 | 151 | 218 | 306 | 322 | 345 | 382 | 295 | 297 | 227 |
| 2014 | 143 | 85 | 81 | 126 | 191 | 250 | 268 | 284 | 353 | 392 | 355 | 309 |
| 2015 | 246 | 169 | 129 | 168 | 213 | 234 | 285 | 360 | 397 | 349 | 324 | 263 |
| 2016 | 180 | 134 | 109 | 171 | 235 | 287 | 335 | 360 | 350 | 314 | 285 | 188 |
| 2017 | 130 | 84 | 66 | 104 | 154 | 209 | 257 | 317 | 382 | 357 | 308 | 272 |
| 2018 | 173 | 103 | 79 | 100 | 158 | 222 | 268 | 316 | 387 | 353 | 320 | 272 |
| 2019 | 179 | 107 | 87 | 115 | 202 | 194 | 202 | 304 | 352 | 365 | 329 | 262 |
| 2020 | 182 | 164 | 111 | 152 | 218 | 317 | 336 | 346 | 386 | 391 | 409 | 328 |
| 2021 | 276 | 163 | 129 | 96 | 188 | 253 | 295 | 321 | 380 | 364 | 339 | 273 |
| 2022 | 144 | 88 | 87 | 89 | 165 | 191 | 276 | 359 | 394 | 385 | 348 | 280 |
| 2023 | 190 | 153 | 110 | 149 | 253 | 298 | 336 | 632 | 630 | 595 | 519 | 474 |
| 2024 | 285 | |||||||||||
| - = No Data Reported; -- = Not Applicable; NA = Not Available; W = Withheld to avoid disclosure of individual company data. |
| Release Date: 3/29/2024 |
| Next Release Date: 4/30/2024 |