|
Download Data (XLS File) |
|
||||||||
|
||||||||
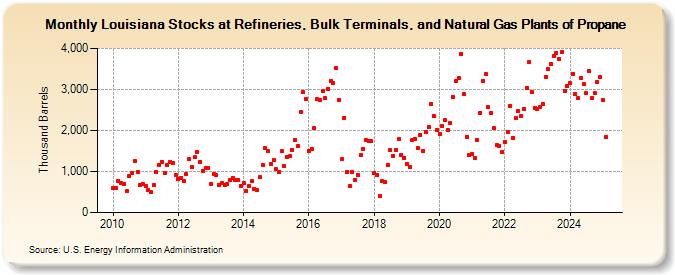
| Louisiana Stocks at Refineries, Bulk Terminals, and Natural Gas Plants of Propane (Thousand Barrels) | ||||||||
| Year | Jan | Feb | Mar | Apr | May | Jun | Jul | Aug | Sep | Oct | Nov | Dec |
|---|---|---|---|---|---|---|---|---|---|---|---|---|
| 2010 | 593 | 601 | 770 | 726 | 694 | 514 | 886 | 964 | 1,254 | 997 | 679 | 688 |
| 2011 | 650 | 554 | 504 | 664 | 983 | 1,169 | 1,238 | 954 | 1,159 | 1,221 | 1,196 | 927 |
| 2012 | 822 | 853 | 766 | 933 | 1,297 | 1,115 | 1,342 | 1,477 | 1,235 | 1,019 | 1,074 | 1,075 |
| 2013 | 706 | 938 | 916 | 680 | 709 | 671 | 695 | 798 | 849 | 800 | 800 | 653 |
| 2014 | 718 | 530 | 642 | 769 | 571 | 544 | 857 | 1,163 | 1,562 | 1,492 | 1,185 | 1,288 |
| 2015 | 1,055 | 996 | 1,489 | 1,135 | 1,355 | 1,369 | 1,523 | 1,764 | 1,622 | 2,460 | 2,929 | 2,777 |
| 2016 | 1,508 | 1,545 | 2,054 | 2,759 | 2,748 | 2,970 | 2,787 | 3,018 | 3,204 | 3,149 | 3,517 | 2,752 |
| 2017 | 1,303 | 2,312 | 999 | 657 | 982 | 805 | 922 | 1,395 | 1,559 | 1,758 | 1,742 | 1,734 |
| 2018 | 953 | 909 | 392 | 768 | 743 | 1,154 | 1,513 | 1,385 | 1,530 | 1,785 | 1,410 | 1,323 |
| 2019 | 1,193 | 1,118 | 1,770 | 1,786 | 1,575 | 1,897 | 1,501 | 1,973 | 2,092 | 2,655 | 2,341 | 2,007 |
| 2020 | 1,908 | 2,110 | 2,246 | 2,006 | 2,187 | 2,810 | 3,208 | 3,273 | 3,858 | 2,893 | 1,843 | 1,400 |
| 2021 | 1,424 | 1,327 | 1,773 | 2,436 | 3,216 | 3,367 | 2,560 | 2,435 | 2,059 | 1,643 | 1,632 | 1,482 |
| 2022 | 1,726 | 1,970 | 2,607 | 1,826 | 2,309 | 2,478 | 2,351 | 2,533 | 3,047 | 3,674 | 2,935 | 2,548 |
| 2023 | 2,523 | 2,561 | 2,642 | 3,303 | 3,488 | 3,609 | 3,825 | 3,889 | 3,810 | 3,902 | 2,958 | 3,074 |
| 2024 | 3,157 | 3,383 | 2,887 | 2,783 | ||||||||
| - = No Data Reported; -- = Not Applicable; NA = Not Available; W = Withheld to avoid disclosure of individual company data. |
| Release Date: 6/28/2024 |
| Next Release Date: 7/31/2024 |