|
Download Data (XLS File) |
|
||||||||
|
||||||||
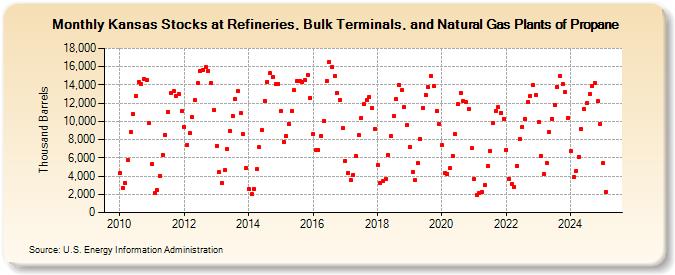
| Kansas Stocks at Refineries, Bulk Terminals, and Natural Gas Plants of Propane (Thousand Barrels) | ||||||||
| Year | Jan | Feb | Mar | Apr | May | Jun | Jul | Aug | Sep | Oct | Nov | Dec |
|---|---|---|---|---|---|---|---|---|---|---|---|---|
| 2010 | 4,292 | 2,726 | 3,267 | 5,784 | 8,853 | 10,804 | 12,735 | 14,327 | 14,054 | 14,622 | 14,515 | 9,835 |
| 2011 | 5,315 | 2,108 | 2,453 | 4,012 | 6,365 | 8,555 | 11,063 | 13,072 | 13,278 | 12,824 | 12,997 | 11,159 |
| 2012 | 9,406 | 7,451 | 8,676 | 10,436 | 12,309 | 14,173 | 15,516 | 15,634 | 15,907 | 15,570 | 14,248 | 11,264 |
| 2013 | 7,327 | 4,416 | 3,275 | 4,635 | 6,958 | 8,958 | 10,572 | 12,429 | 13,323 | 10,864 | 8,563 | 4,902 |
| 2014 | 2,554 | 2,000 | 2,600 | 4,724 | 7,154 | 9,048 | 12,281 | 14,368 | 15,250 | 14,834 | 14,042 | 14,097 |
| 2015 | 11,147 | 7,789 | 8,420 | 9,740 | 11,136 | 13,385 | 14,414 | 14,371 | 14,295 | 14,511 | 15,034 | 12,570 |
| 2016 | 8,579 | 6,819 | 6,906 | 8,408 | 10,083 | 14,437 | 16,549 | 15,935 | 14,985 | 13,082 | 12,337 | 9,217 |
| 2017 | 5,637 | 4,386 | 3,574 | 4,163 | 6,186 | 8,487 | 10,398 | 11,870 | 12,328 | 12,700 | 11,445 | 9,213 |
| 2018 | 5,239 | 3,220 | 3,423 | 3,701 | 6,326 | 8,371 | 10,541 | 12,448 | 13,986 | 13,398 | 11,563 | 9,613 |
| 2019 | 7,228 | 4,439 | 3,556 | 5,408 | 8,038 | 11,488 | 12,905 | 13,737 | 14,972 | 13,826 | 11,150 | 9,706 |
| 2020 | 7,412 | 4,320 | 4,235 | 4,843 | 6,241 | 8,606 | 11,853 | 13,158 | 12,223 | 12,090 | 11,328 | 7,040 |
| 2021 | 3,688 | 1,873 | 2,176 | 2,230 | 2,999 | 5,081 | 6,775 | 9,803 | 11,091 | 11,545 | 10,966 | 10,264 |
| 2022 | 6,894 | 3,726 | 3,141 | 2,790 | 5,111 | 8,040 | 9,404 | 10,256 | 12,079 | 12,793 | 13,987 | 12,841 |
| 2023 | 9,942 | 6,187 | 4,319 | 5,456 | 8,820 | 10,310 | 11,794 | 13,611 | 14,959 | 14,121 | 13,187 | 10,368 |
| 2024 | 6,698 | |||||||||||
| - = No Data Reported; -- = Not Applicable; NA = Not Available; W = Withheld to avoid disclosure of individual company data. |
| Release Date: 3/29/2024 |
| Next Release Date: 4/30/2024 |