|
Download Data (XLS File) |
|
||||||||
|
||||||||
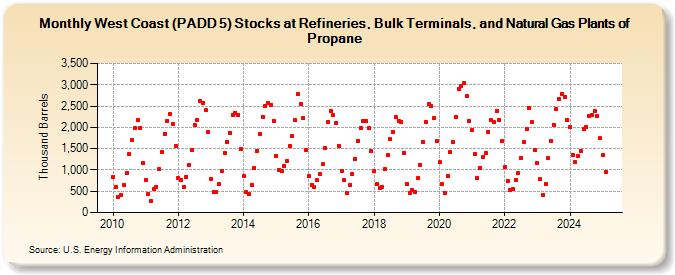
| West Coast (PADD 5) Stocks at Refineries, Bulk Terminals, and Natural Gas Plants of Propane (Thousand Barrels) | ||||||||
| Year | Jan | Feb | Mar | Apr | May | Jun | Jul | Aug | Sep | Oct | Nov | Dec |
|---|---|---|---|---|---|---|---|---|---|---|---|---|
| 2010 | 836 | 602 | 365 | 418 | 645 | 933 | 1,372 | 1,700 | 1,982 | 2,169 | 1,996 | 1,175 |
| 2011 | 765 | 438 | 262 | 553 | 609 | 1,011 | 1,427 | 1,842 | 2,158 | 2,310 | 2,090 | 1,567 |
| 2012 | 812 | 758 | 605 | 842 | 1,111 | 1,460 | 2,051 | 2,183 | 2,627 | 2,579 | 2,398 | 1,890 |
| 2013 | 789 | 491 | 491 | 660 | 965 | 1,404 | 1,668 | 1,879 | 2,282 | 2,338 | 2,299 | 1,488 |
| 2014 | 851 | 494 | 446 | 645 | 1,051 | 1,444 | 1,842 | 2,243 | 2,500 | 2,571 | 2,535 | 2,156 |
| 2015 | 1,329 | 1,002 | 965 | 1,103 | 1,213 | 1,565 | 1,801 | 2,173 | 2,790 | 2,541 | 2,209 | 1,464 |
| 2016 | 864 | 651 | 592 | 758 | 908 | 1,132 | 1,512 | 2,126 | 2,385 | 2,300 | 2,111 | 1,563 |
| 2017 | 986 | 756 | 457 | 644 | 911 | 1,253 | 1,679 | 1,978 | 2,159 | 2,144 | 1,974 | 1,449 |
| 2018 | 967 | 668 | 573 | 605 | 1,011 | 1,348 | 1,720 | 1,882 | 2,244 | 2,159 | 2,127 | 1,405 |
| 2019 | 675 | 461 | 526 | 477 | 804 | 1,128 | 1,653 | 2,126 | 2,540 | 2,512 | 2,227 | 1,673 |
| 2020 | 1,176 | 669 | 468 | 864 | 1,418 | 1,664 | 2,240 | 2,908 | 2,975 | 3,031 | 2,735 | 2,143 |
| 2021 | 1,939 | 1,376 | 804 | 1,054 | 1,296 | 1,405 | 1,902 | 2,165 | 2,117 | 2,391 | 2,181 | 1,670 |
| 2022 | 1,064 | 742 | 536 | 549 | 768 | 923 | 1,287 | 1,652 | 1,958 | 2,452 | 2,127 | 1,480 |
| 2023 | 1,153 | 789 | 416 | 680 | 1,270 | 1,675 | 2,062 | 2,436 | 2,646 | 2,794 | 2,715 | 2,172 |
| 2024 | 2,005 | |||||||||||
| - = No Data Reported; -- = Not Applicable; NA = Not Available; W = Withheld to avoid disclosure of individual company data. |
| Release Date: 3/29/2024 |
| Next Release Date: 4/30/2024 |