|
Download Data (XLS File) |
|
||||||||
|
||||||||
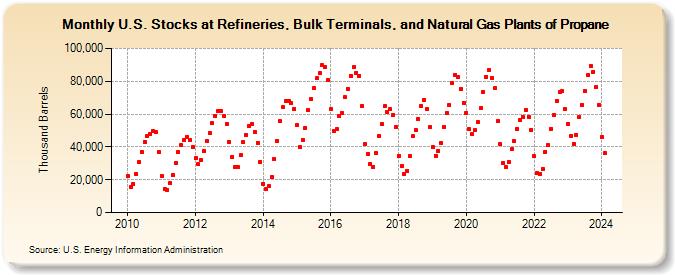
| U.S. Stocks at Refineries, Bulk Terminals, and Natural Gas Plants of Propane (Thousand Barrels) | ||||||||
| Year | Jan | Feb | Mar | Apr | May | Jun | Jul | Aug | Sep | Oct | Nov | Dec |
|---|---|---|---|---|---|---|---|---|---|---|---|---|
| 2010 | 22,207 | 15,771 | 17,550 | 23,663 | 30,556 | 37,130 | 43,051 | 46,572 | 47,909 | 49,639 | 49,313 | 36,845 |
| 2011 | 22,498 | 14,322 | 13,838 | 18,072 | 22,825 | 30,155 | 37,011 | 41,293 | 44,213 | 46,059 | 44,436 | 39,812 |
| 2012 | 33,211 | 29,286 | 32,232 | 37,532 | 43,329 | 48,363 | 54,512 | 58,875 | 61,778 | 61,640 | 58,733 | 53,979 |
| 2013 | 42,976 | 33,869 | 27,651 | 27,628 | 34,842 | 42,795 | 47,332 | 52,866 | 54,103 | 49,094 | 42,573 | 30,953 |
| 2014 | 17,593 | 14,566 | 16,009 | 21,773 | 32,727 | 43,765 | 55,543 | 64,239 | 67,703 | 68,089 | 66,684 | 63,351 |
| 2015 | 53,254 | 40,122 | 44,340 | 51,786 | 62,232 | 69,040 | 75,599 | 81,792 | 84,719 | 89,631 | 88,826 | 80,704 |
| 2016 | 62,848 | 49,846 | 50,678 | 58,983 | 60,651 | 70,225 | 75,466 | 83,405 | 88,372 | 85,220 | 83,200 | 65,194 |
| 2017 | 41,721 | 35,968 | 29,449 | 27,869 | 36,241 | 46,855 | 53,894 | 64,688 | 61,065 | 62,799 | 59,675 | 52,052 |
| 2018 | 34,748 | 28,489 | 23,512 | 25,531 | 34,148 | 46,413 | 50,164 | 56,818 | 65,102 | 68,599 | 62,958 | 51,973 |
| 2019 | 39,954 | 34,632 | 37,692 | 42,662 | 52,360 | 60,556 | 65,464 | 79,180 | 83,908 | 82,343 | 75,408 | 66,939 |
| 2020 | 60,931 | 50,718 | 47,758 | 50,021 | 55,056 | 63,406 | 73,297 | 82,747 | 87,115 | 82,144 | 75,831 | 55,622 |
| 2021 | 41,542 | 30,006 | 27,743 | 31,018 | 38,634 | 43,551 | 51,146 | 56,530 | 58,438 | 62,574 | 58,416 | 50,500 |
| 2022 | 34,291 | 23,854 | 23,441 | 26,689 | 37,070 | 41,131 | 51,102 | 59,465 | 68,219 | 73,238 | 73,937 | 63,073 |
| 2023 | 54,148 | 46,998 | 41,483 | 47,379 | 58,371 | 65,889 | 73,430 | 83,782 | 89,297 | 85,793 | 76,602 | 65,797 |
| 2024 | 46,178 | 36,369 | 38,292 | 44,028 | 53,514 | 61,671 | ||||||
| - = No Data Reported; -- = Not Applicable; NA = Not Available; W = Withheld to avoid disclosure of individual company data. |
| Release Date: 8/30/2024 |
| Next Release Date: 9/30/2024 |