|
Download Data (XLS File) |
|
||||||||
|
||||||||
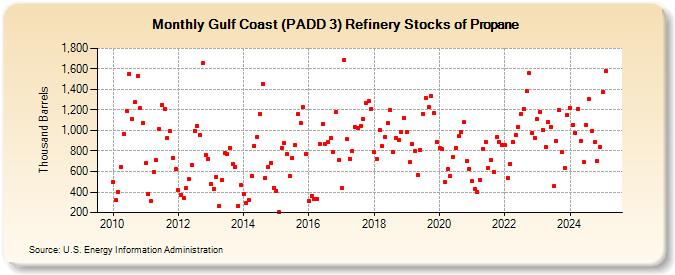
| Gulf Coast (PADD 3) Refinery Stocks of Propane (Thousand Barrels) | ||||||||
| Year | Jan | Feb | Mar | Apr | May | Jun | Jul | Aug | Sep | Oct | Nov | Dec |
|---|---|---|---|---|---|---|---|---|---|---|---|---|
| 2010 | 499 | 319 | 403 | 648 | 968 | 1,193 | 1,554 | 1,114 | 1,275 | 1,533 | 1,219 | 1,075 |
| 2011 | 680 | 384 | 312 | 596 | 710 | 1,019 | 1,251 | 1,212 | 930 | 991 | 730 | 625 |
| 2012 | 415 | 375 | 346 | 439 | 529 | 661 | 997 | 1,047 | 952 | 1,654 | 763 | 719 |
| 2013 | 476 | 434 | 547 | 261 | 517 | 776 | 769 | 828 | 671 | 645 | 263 | 464 |
| 2014 | 377 | 296 | 318 | 557 | 853 | 939 | 1,159 | 1,454 | 536 | 642 | 684 | 444 |
| 2015 | 414 | 205 | 831 | 879 | 768 | 554 | 734 | 861 | 1,156 | 1,074 | 1,224 | 770 |
| 2016 | 314 | 366 | 337 | 333 | 866 | 1,061 | 870 | 892 | 929 | 789 | 1,176 | 715 |
| 2017 | 441 | 1,686 | 914 | 725 | 796 | 1,031 | 1,023 | 1,042 | 1,110 | 1,270 | 1,283 | 1,212 |
| 2018 | 789 | 720 | 1,000 | 849 | 941 | 1,073 | 1,200 | 789 | 927 | 912 | 983 | 1,121 |
| 2019 | 983 | 690 | 871 | 798 | 563 | 807 | 1,164 | 1,321 | 1,226 | 1,338 | 1,174 | 892 |
| 2020 | 831 | 815 | 495 | 624 | 557 | 739 | 825 | 942 | 983 | 1,078 | 700 | 620 |
| 2021 | 503 | 433 | 401 | 519 | 822 | 889 | 637 | 708 | 593 | 934 | 885 | 855 |
| 2022 | 854 | 538 | 675 | 883 | 957 | 1,036 | 1,162 | 1,209 | 1,380 | 1,556 | 975 | 928 |
| 2023 | 1,108 | 1,182 | 1,004 | 840 | 1,083 | 1,038 | 454 | 894 | 1,198 | 790 | 636 | 1,151 |
| 2024 | 1,219 | 1,056 | 976 | 1,208 | ||||||||
| - = No Data Reported; -- = Not Applicable; NA = Not Available; W = Withheld to avoid disclosure of individual company data. |
| Release Date: 6/28/2024 |
| Next Release Date: 7/31/2024 |