|
Download Data (XLS File) |
|
||||||||
|
||||||||
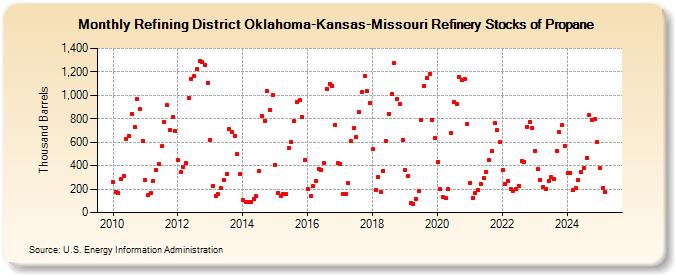
| Refining District Oklahoma-Kansas-Missouri Refinery Stocks of Propane (Thousand Barrels) | ||||||||
| Year | Jan | Feb | Mar | Apr | May | Jun | Jul | Aug | Sep | Oct | Nov | Dec |
|---|---|---|---|---|---|---|---|---|---|---|---|---|
| 2010 | 264 | 179 | 165 | 283 | 308 | 629 | 656 | 841 | 728 | 972 | 879 | 611 |
| 2011 | 281 | 149 | 164 | 272 | 363 | 418 | 565 | 776 | 917 | 704 | 814 | 694 |
| 2012 | 448 | 345 | 392 | 425 | 974 | 1,142 | 1,164 | 1,225 | 1,289 | 1,281 | 1,255 | 1,107 |
| 2013 | 618 | 228 | 144 | 156 | 206 | 275 | 330 | 714 | 688 | 657 | 497 | 325 |
| 2014 | 108 | 90 | 94 | 94 | 112 | 138 | 358 | 827 | 784 | 1,037 | 876 | 1,005 |
| 2015 | 409 | 167 | 137 | 156 | 155 | 551 | 600 | 778 | 945 | 957 | 814 | 448 |
| 2016 | 203 | 138 | 228 | 268 | 373 | 365 | 419 | 1,056 | 1,099 | 1,076 | 748 | 419 |
| 2017 | 415 | 157 | 157 | 248 | 607 | 725 | 644 | 861 | 1,028 | 1,163 | 1,033 | 937 |
| 2018 | 539 | 189 | 301 | 174 | 353 | 608 | 842 | 1,013 | 1,272 | 968 | 928 | 615 |
| 2019 | 361 | 314 | 83 | 71 | 118 | 180 | 789 | 1,083 | 1,150 | 1,182 | 792 | 635 |
| 2020 | 434 | 198 | 132 | 121 | 200 | 676 | 940 | 929 | 1,158 | 1,128 | 1,136 | 751 |
| 2021 | 254 | 125 | 163 | 196 | 244 | 298 | 350 | 450 | 523 | 762 | 700 | 601 |
| 2022 | 367 | 242 | 273 | 198 | 186 | 202 | 229 | 439 | 430 | 732 | 771 | 724 |
| 2023 | 528 | 372 | 377 | 219 | 198 | 273 | 303 | 286 | 527 | 686 | 745 | 568 |
| 2024 | 337 | 340 | 189 | 208 | ||||||||
| - = No Data Reported; -- = Not Applicable; NA = Not Available; W = Withheld to avoid disclosure of individual company data. |
| Release Date: 6/28/2024 |
| Next Release Date: 7/31/2024 |
Referring Pages: