|
Download Data (XLS File) |
|
||||||||
|
||||||||
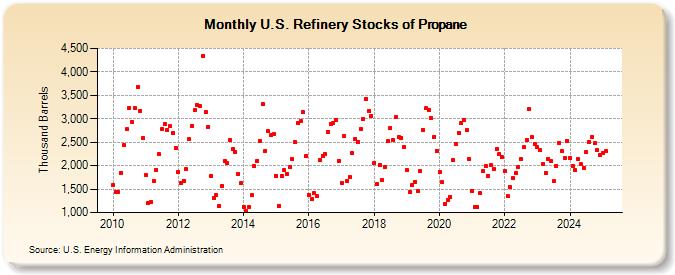
| U.S. Refinery Stocks of Propane (Thousand Barrels) | ||||||||
| Year | Jan | Feb | Mar | Apr | May | Jun | Jul | Aug | Sep | Oct | Nov | Dec |
|---|---|---|---|---|---|---|---|---|---|---|---|---|
| 2010 | 1,583 | 1,440 | 1,431 | 1,850 | 2,436 | 2,771 | 3,234 | 2,941 | 3,221 | 3,681 | 3,173 | 2,590 |
| 2011 | 1,792 | 1,204 | 1,234 | 1,669 | 1,913 | 2,240 | 2,780 | 2,896 | 2,763 | 2,838 | 2,699 | 2,387 |
| 2012 | 1,869 | 1,627 | 1,681 | 1,922 | 2,562 | 2,852 | 3,184 | 3,286 | 3,268 | 4,338 | 3,138 | 2,834 |
| 2013 | 1,776 | 1,312 | 1,366 | 1,141 | 1,567 | 2,100 | 2,053 | 2,542 | 2,354 | 2,294 | 1,830 | 1,621 |
| 2014 | 1,126 | 1,029 | 1,116 | 1,369 | 1,991 | 2,106 | 2,534 | 3,309 | 2,318 | 2,731 | 2,644 | 2,668 |
| 2015 | 1,786 | 1,149 | 1,780 | 1,897 | 1,826 | 1,968 | 2,136 | 2,496 | 2,900 | 2,949 | 3,135 | 2,215 |
| 2016 | 1,384 | 1,282 | 1,409 | 1,344 | 2,115 | 2,214 | 2,241 | 2,723 | 2,887 | 2,910 | 2,978 | 2,109 |
| 2017 | 1,631 | 2,629 | 1,673 | 1,761 | 2,264 | 2,568 | 2,506 | 2,786 | 2,997 | 3,430 | 3,173 | 3,067 |
| 2018 | 2,057 | 1,601 | 2,024 | 1,692 | 1,969 | 2,519 | 2,811 | 2,537 | 3,041 | 2,610 | 2,599 | 2,407 |
| 2019 | 1,903 | 1,433 | 1,592 | 1,657 | 1,460 | 1,877 | 2,770 | 3,221 | 3,180 | 3,007 | 2,615 | 2,316 |
| 2020 | 1,865 | 1,642 | 1,191 | 1,264 | 1,333 | 2,126 | 2,470 | 2,706 | 2,899 | 2,974 | 2,751 | 2,144 |
| 2021 | 1,449 | 1,117 | 1,124 | 1,410 | 1,883 | 1,993 | 1,786 | 2,010 | 1,936 | 2,351 | 2,251 | 2,182 |
| 2022 | 1,877 | 1,353 | 1,541 | 1,731 | 1,839 | 1,968 | 2,140 | 2,388 | 2,542 | 3,206 | 2,605 | 2,460 |
| 2023 | 2,396 | 2,328 | 2,136 | 1,841 | 2,142 | 2,100 | 1,665 | 2,000 | 2,490 | 2,313 | 2,163 | 2,535 |
| 2024 | 2,167 | |||||||||||
| - = No Data Reported; -- = Not Applicable; NA = Not Available; W = Withheld to avoid disclosure of individual company data. |
| Release Date: 3/29/2024 |
| Next Release Date: 4/30/2024 |