|
Download Data (XLS File) |
|
||||||||
|
||||||||
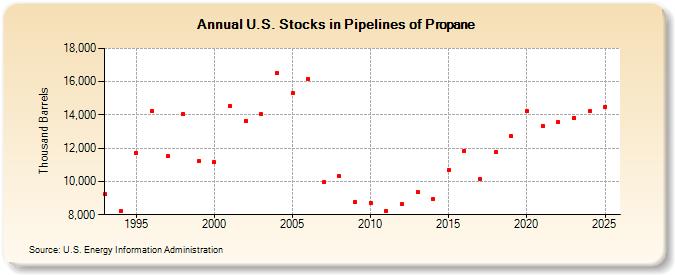
| U.S. Stocks in Pipelines of Propane (Thousand Barrels) | ||||||||
| Decade | Year-0 | Year-1 | Year-2 | Year-3 | Year-4 | Year-5 | Year-6 | Year-7 | Year-8 | Year-9 |
|---|---|---|---|---|---|---|---|---|---|---|
| 1990's | 9,216 | 8,202 | 11,716 | 14,210 | 11,511 | 14,041 | 11,226 | |||
| 2000's | 11,156 | 14,533 | 13,655 | 14,040 | 16,493 | 15,313 | 16,171 | 9,937 | 10,302 | 8,761 |
| 2010's | 8,694 | 8,237 | 8,619 | 9,389 | 8,946 | 10,675 | 11,853 | 10,131 | 11,765 | 12,717 |
| 2020's | 14,234 | 13,339 | 13,569 | 13,938 |
| - = No Data Reported; -- = Not Applicable; NA = Not Available; W = Withheld to avoid disclosure of individual company data. |
| Release Date: 3/29/2024 |
| Next Release Date: 8/30/2024 |
Referring Pages: