|
Download Data (XLS File) |
|
||||||||
|
||||||||
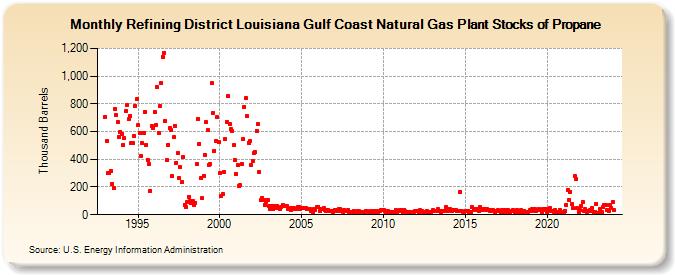
| Refining District Louisiana Gulf Coast Natural Gas Plant Stocks of Propane (Thousand Barrels) | ||||||||
| Year | Jan | Feb | Mar | Apr | May | Jun | Jul | Aug | Sep | Oct | Nov | Dec |
|---|---|---|---|---|---|---|---|---|---|---|---|---|
| 1993 | 704 | 533 | 299 | 300 | 317 | 224 | 195 | 766 | 720 | 669 | 564 | 598 |
| 1994 | 581 | 503 | 552 | 748 | 793 | 687 | 711 | 519 | 514 | 570 | 781 | 834 |
| 1995 | 645 | 588 | 427 | 516 | 591 | 744 | 505 | 397 | 363 | 173 | 640 | 623 |
| 1996 | 742 | 649 | 925 | 593 | 785 | 950 | 1,138 | 1,166 | 676 | 393 | 506 | 624 |
| 1997 | 611 | 279 | 560 | 643 | 376 | 447 | 263 | 341 | 235 | 413 | 73 | 59 |
| 1998 | 93 | 128 | 99 | 86 | 96 | 70 | 87 | 365 | 693 | 512 | 263 | 118 |
| 1999 | 282 | 433 | 667 | 610 | 356 | 364 | 947 | 733 | 462 | 534 | 703 | 524 |
| 2000 | 301 | 132 | 151 | 310 | 548 | 669 | 855 | 654 | 617 | 603 | 501 | 392 |
| 2001 | 292 | 356 | 207 | 211 | 368 | 543 | 780 | 841 | 709 | 520 | 531 | 361 |
| 2002 | 390 | 445 | 451 | 606 | 651 | 307 | 104 | 123 | 107 | 73 | 92 | 109 |
| 2003 | 60 | 43 | 60 | 42 | 60 | 49 | 62 | 46 | 44 | 56 | 72 | 63 |
| 2004 | 60 | 61 | 38 | 45 | 31 | 45 | 49 | 41 | 39 | 55 | 57 | 41 |
| 2005 | 51 | 52 | 45 | 49 | 38 | 44 | 42 | 30 | 22 | 39 | 36 | 54 |
| 2006 | 59 | 30 | 39 | 40 | 49 | 36 | 28 | 33 | 30 | 29 | 25 | 23 |
| 2007 | 35 | 33 | 30 | 43 | 38 | 28 | 22 | 31 | 25 | 26 | 35 | 20 |
| 2008 | 16 | 21 | 26 | 18 | 16 | 29 | 24 | 19 | 20 | 20 | 21 | 28 |
| 2009 | 25 | 23 | 22 | 26 | 22 | 28 | 18 | 28 | 23 | 24 | 34 | 35 |
| 2010 | 31 | 26 | 21 | 25 | 22 | 20 | 23 | 19 | 13 | 33 | 17 | 30 |
| 2011 | 35 | 32 | 18 | 37 | 24 | 20 | 23 | 21 | 20 | 22 | 23 | 25 |
| 2012 | 27 | 26 | 19 | 32 | 28 | 21 | 15 | 21 | 26 | 21 | 21 | 20 |
| 2013 | 31 | 27 | 27 | 24 | 38 | 30 | 22 | 29 | 24 | 24 | 55 | 24 |
| 2014 | 38 | 39 | 28 | 34 | 35 | 32 | 28 | 25 | 166 | 29 | 23 | 21 |
| 2015 | 26 | 24 | 29 | 23 | 23 | 55 | 41 | 34 | 41 | 41 | 30 | 53 |
| 2016 | 33 | 38 | 42 | 34 | 38 | 37 | 26 | 35 | 31 | 24 | 21 | 24 |
| 2017 | 32 | 28 | 21 | 32 | 21 | 35 | 15 | 35 | 17 | 15 | 30 | 34 |
| 2018 | 19 | 19 | 31 | 14 | 16 | 31 | 13 | 30 | 23 | 23 | 21 | 31 |
| 2019 | 29 | 38 | 30 | 40 | 27 | 36 | 39 | 33 | 23 | 44 | 31 | 43 |
| 2020 | 22 | 38 | 45 | 28 | 30 | 22 | 35 | 18 | 20 | 33 | 18 | 9 |
| 2021 | 14 | 27 | 72 | 180 | 107 | 166 | 79 | 45 | 276 | 261 | 48 | 21 |
| 2022 | 34 | 64 | 91 | 26 | 40 | 21 | 25 | 34 | 25 | 50 | 20 | 23 |
| 2023 | 80 | 10 | 14 | 38 | 21 | 54 | 73 | 71 | 36 | 29 | 73 | 51 |
| 2024 | 93 | |||||||||||
| - = No Data Reported; -- = Not Applicable; NA = Not Available; W = Withheld to avoid disclosure of individual company data. |
| Release Date: 3/29/2024 |
| Next Release Date: 4/30/2024 |