|
Download Data (XLS File) |
|
||||||||
|
||||||||
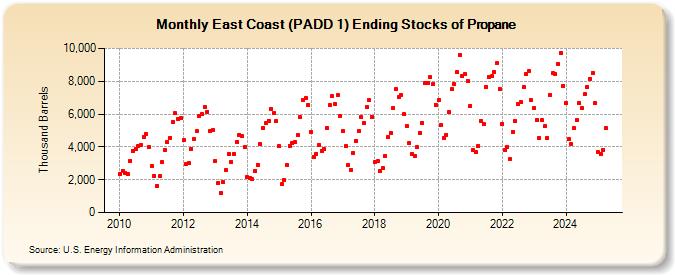
| East Coast (PADD 1) Ending Stocks of Propane (Thousand Barrels) | ||||||||
| Year | Jan | Feb | Mar | Apr | May | Jun | Jul | Aug | Sep | Oct | Nov | Dec |
|---|---|---|---|---|---|---|---|---|---|---|---|---|
| 2010 | 2,378 | 2,553 | 2,429 | 2,322 | 3,131 | 3,768 | 3,864 | 4,041 | 4,117 | 4,621 | 4,795 | 3,989 |
| 2011 | 2,840 | 2,256 | 1,636 | 2,211 | 3,089 | 3,822 | 4,299 | 4,571 | 5,504 | 6,045 | 5,701 | 5,773 |
| 2012 | 4,400 | 2,976 | 2,998 | 3,901 | 4,497 | 4,947 | 5,870 | 6,013 | 6,435 | 6,155 | 4,970 | 5,043 |
| 2013 | 3,151 | 1,805 | 1,189 | 1,844 | 2,589 | 3,587 | 3,084 | 3,595 | 4,328 | 4,746 | 4,650 | 3,989 |
| 2014 | 2,163 | 2,124 | 2,015 | 2,545 | 2,910 | 4,170 | 5,168 | 5,447 | 5,595 | 6,313 | 6,052 | 5,566 |
| 2015 | 4,027 | 1,753 | 1,963 | 2,879 | 4,074 | 4,215 | 4,273 | 4,720 | 5,807 | 6,854 | 6,986 | 6,573 |
| 2016 | 4,904 | 3,411 | 3,591 | 4,137 | 3,767 | 3,860 | 5,168 | 6,548 | 7,078 | 6,620 | 7,143 | 5,855 |
| 2017 | 4,951 | 4,046 | 2,873 | 2,619 | 3,638 | 4,383 | 4,948 | 5,797 | 5,460 | 6,436 | 6,849 | 5,845 |
| 2018 | 3,093 | 3,117 | 2,534 | 2,699 | 3,440 | 4,606 | 4,872 | 6,355 | 7,523 | 7,038 | 7,173 | 5,987 |
| 2019 | 5,280 | 4,217 | 3,571 | 3,470 | 3,965 | 4,865 | 5,456 | 7,895 | 7,914 | 8,236 | 7,824 | 6,568 |
| 2020 | 6,840 | 5,306 | 4,571 | 4,753 | 6,130 | 7,512 | 7,812 | 8,546 | 9,625 | 8,342 | 8,415 | 8,037 |
| 2021 | 6,521 | 3,830 | 3,684 | 4,062 | 5,594 | 5,388 | 7,677 | 8,286 | 8,289 | 8,568 | 9,085 | 7,520 |
| 2022 | 5,412 | 3,783 | 4,003 | 3,233 | 4,909 | 5,569 | 6,635 | 6,717 | 7,644 | 8,470 | 8,598 | 6,839 |
| 2023 | 6,354 | 5,648 | 4,953 | 5,620 | 5,243 | 4,561 | 7,759 | 8,490 | 8,469 | 9,070 | 9,747 | 7,736 |
| 2024 | 6,672 | |||||||||||
| - = No Data Reported; -- = Not Applicable; NA = Not Available; W = Withheld to avoid disclosure of individual company data. |
| Release Date: 3/29/2024 |
| Next Release Date: 4/30/2024 |