|
Download Data (XLS File) |
|
|||||
|
|||||
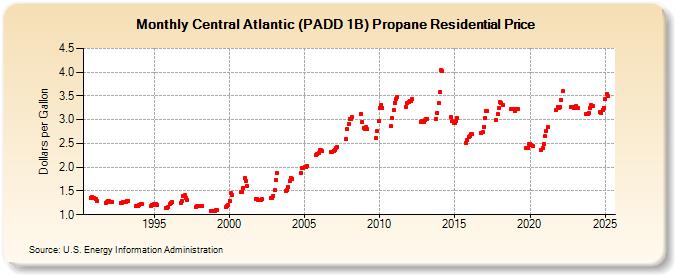
| Central Atlantic (PADD 1B) Propane Residential Price (Dollars per Gallon) | |||||
| Year | Jan | Feb | Mar | Apr | May | Jun | Jul | Aug | Sep | Oct | Nov | Dec |
|---|---|---|---|---|---|---|---|---|---|---|---|---|
| 1990 | 1.360 | 1.364 | 1.362 | |||||||||
| 1991 | 1.358 | 1.322 | 1.286 | 1.255 | 1.270 | 1.294 | ||||||
| 1992 | 1.287 | 1.278 | 1.268 | 1.252 | 1.256 | 1.264 | ||||||
| 1993 | 1.273 | 1.270 | 1.298 | 1.296 | 1.182 | 1.183 | 1.187 | |||||
| 1994 | 1.199 | 1.232 | 1.234 | 1.184 | 1.214 | 1.201 | ||||||
| 1995 | 1.216 | 1.222 | 1.205 | 1.149 | 1.148 | 1.164 | ||||||
| 1996 | 1.215 | 1.255 | 1.266 | 1.250 | 1.291 | 1.403 | ||||||
| 1997 | 1.405 | 1.358 | 1.315 | 1.165 | 1.174 | 1.183 | ||||||
| 1998 | 1.188 | 1.186 | 1.176 | 1.081 | 1.088 | 1.088 | ||||||
| 1999 | 1.087 | 1.093 | 1.091 | 1.154 | 1.177 | 1.200 | ||||||
| 2000 | 1.298 | 1.450 | 1.421 | 1.470 | 1.485 | 1.565 | ||||||
| 2001 | 1.765 | 1.703 | 1.609 | 1.335 | 1.325 | 1.300 | ||||||
| 2002 | 1.312 | 1.315 | 1.321 | 1.342 | 1.359 | 1.403 | ||||||
| 2003 | 1.516 | 1.725 | 1.883 | 1.497 | 1.513 | 1.577 | ||||||
| 2004 | 1.712 | 1.781 | 1.758 | 1.879 | 1.980 | 1.993 | ||||||
| 2005 | 2.000 | 2.005 | 2.023 | 2.260 | 2.268 | 2.301 | ||||||
| 2006 | 2.359 | 2.354 | 2.338 | 2.327 | 2.319 | 2.348 | ||||||
| 2007 | 2.355 | 2.397 | 2.419 | 2.593 | 2.803 | 2.918 | ||||||
| 2008 | 3.022 | 3.023 | 3.059 | 3.128 | 2.956 | 2.832 | ||||||
| 2009 | 2.800 | 2.841 | 2.797 | 2.617 | 2.762 | 2.964 | ||||||
| 2010 | 3.250 | 3.307 | 3.255 | 2.859 | 3.025 | 3.207 | ||||||
| 2011 | 3.359 | 3.431 | 3.487 | 3.277 | 3.343 | 3.367 | ||||||
| 2012 | 3.402 | 3.401 | 3.425 | 2.953 | 2.978 | 2.959 | ||||||
| 2013 | 2.983 | 3.011 | 3.015 | 3.019 | 3.142 | 3.350 | ||||||
| 2014 | 3.581 | 4.053 | 4.015 | 3.059 | 2.966 | 2.938 | ||||||
| 2015 | 2.924 | 2.967 | 3.032 | 2.516 | 2.569 | 2.641 | ||||||
| 2016 | 2.660 | 2.701 | 2.692 | 2.711 | 2.744 | 2.854 | ||||||
| 2017 | 3.033 | 3.185 | 3.189 | 2.993 | 3.117 | 3.240 | ||||||
| 2018 | 3.374 | 3.341 | 3.300 | 3.221 | 3.230 | 3.233 | ||||||
| 2019 | 3.190 | 3.218 | 3.217 | 2.397 | 2.411 | 2.481 | ||||||
| 2020 | 2.489 | 2.465 | 2.449 | 2.370 | 2.397 | 2.497 | ||||||
| 2021 | 2.651 | 2.772 | 2.836 | 3.206 | 3.267 | 3.244 | ||||||
| 2022 | 3.265 | 3.414 | 3.598 | 3.265 | 3.275 | 3.244 | ||||||
| 2023 | 3.256 | 3.278 | 3.254 | 3.129 | 3.123 | 3.148 | ||||||
| 2024 | 3.237 | 3.309 | 3.294 | |||||||||
| - = No Data Reported; -- = Not Applicable; NA = Not Available; W = Withheld to avoid disclosure of individual company data. |
| Release Date: 4/17/2024 |
| Next Release Date: 4/24/2024 |