|
Download Data (XLS File) |
|
||||||||
|
||||||||
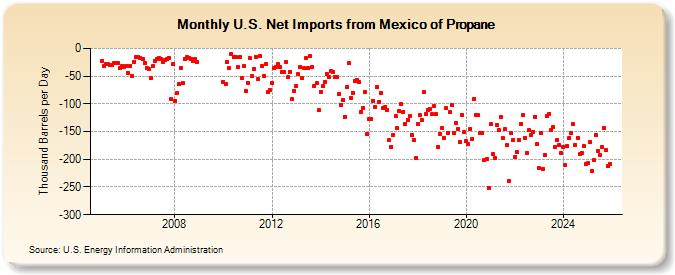
| U.S. Net Imports from Mexico of Propane (Thousand Barrels per Day) | ||||||||
| Year | Jan | Feb | Mar | Apr | May | Jun | Jul | Aug | Sep | Oct | Nov | Dec |
|---|---|---|---|---|---|---|---|---|---|---|---|---|
| 2005 | -23 | -31 | -28 | -29 | -30 | -30 | -27 | -26 | -27 | -35 | -31 | -33 |
| 2006 | -31 | -44 | -31 | -49 | -24 | -16 | -16 | -17 | -19 | -26 | -35 | -38 |
| 2007 | -53 | -32 | -22 | -19 | -17 | -19 | -24 | -21 | -19 | -17 | -92 | -29 |
| 2008 | -94 | -81 | -65 | -36 | -63 | -19 | -16 | -17 | -19 | -22 | -19 | -25 |
| 2010 | -60 | -65 | -24 | -36 | -10 | -16 | -16 | -34 | -16 | -53 | -32 | -77 |
| 2011 | -62 | -18 | -50 | -37 | -15 | -55 | -13 | -31 | -50 | -29 | -79 | -75 |
| 2012 | -63 | -36 | -34 | -29 | -34 | -42 | -42 | -24 | -52 | -42 | -92 | -76 |
| 2013 | -67 | -47 | -34 | -54 | -36 | -18 | -36 | -14 | -34 | -67 | -63 | -112 |
| 2014 | -78 | -68 | -60 | -46 | -52 | -40 | -42 | -52 | -52 | -82 | -102 | -93 |
| 2015 | -123 | -69 | -27 | -89 | -80 | -58 | -57 | -61 | -114 | -107 | -79 | -155 |
| 2016 | -128 | -127 | -95 | -105 | -69 | -96 | -81 | -107 | -105 | -111 | -166 | -177 |
| 2017 | -156 | -122 | -144 | -113 | -101 | -114 | -136 | -129 | -122 | -156 | -165 | -198 |
| 2018 | -136 | -121 | -130 | -79 | -118 | -111 | -109 | -119 | -104 | -119 | -177 | -154 |
| 2019 | -144 | -162 | -108 | -153 | -115 | -103 | -153 | -134 | -145 | -169 | -120 | -151 |
| 2020 | -167 | -173 | -145 | -163 | -91 | -121 | -121 | -152 | -153 | -201 | -200 | -251 |
| 2021 | -137 | -191 | -197 | -138 | -148 | -124 | -162 | -146 | -175 | -240 | -152 | -166 |
| 2022 | -195 | -186 | -166 | -137 | -121 | -161 | -188 | -148 | -157 | -150 | -123 | -173 |
| 2023 | -177 | -129 | -196 | -148 | -87 | -97 | -119 | -115 | -144 | -165 | -175 | -189 |
| 2024 | -178 | |||||||||||
| - = No Data Reported; -- = Not Applicable; NA = Not Available; W = Withheld to avoid disclosure of individual company data. |
| Release Date: 3/29/2024 |
| Next Release Date: 4/30/2024 |