|
Download Data (XLS File) |
|
||||||||
|
||||||||
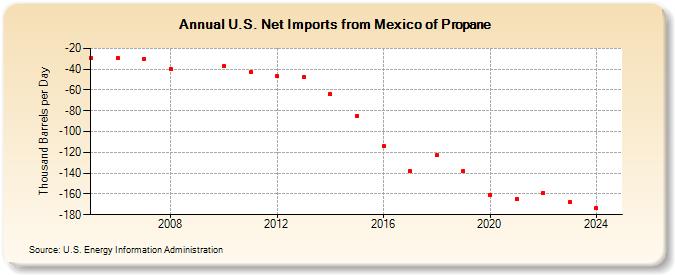
| U.S. Net Imports from Mexico of Propane (Thousand Barrels per Day) | ||||||||
| Decade | Year-0 | Year-1 | Year-2 | Year-3 | Year-4 | Year-5 | Year-6 | Year-7 | Year-8 | Year-9 |
|---|---|---|---|---|---|---|---|---|---|---|
| 2000's | -29 | -29 | -30 | -40 | ||||||
| 2010's | -37 | -43 | -47 | -48 | -64 | -85 | -114 | -138 | -123 | -138 |
| 2020's | -161 | -165 | -159 | -168 |
| - = No Data Reported; -- = Not Applicable; NA = Not Available; W = Withheld to avoid disclosure of individual company data. |
| Release Date: 8/30/2024 |
| Next Release Date: 8/29/2025 |