|
Download Data (XLS File) |
|
||||||||
|
||||||||
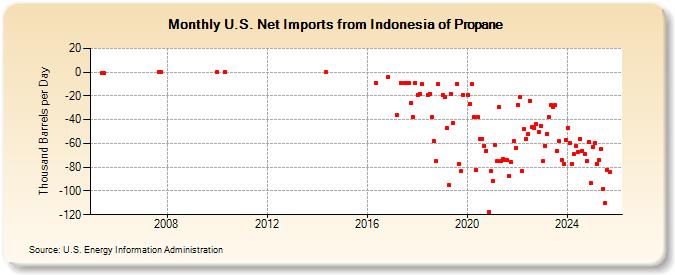
| U.S. Net Imports from Indonesia of Propane (Thousand Barrels per Day) | ||||||||
| Year | Jan | Feb | Mar | Apr | May | Jun | Jul | Aug | Sep | Oct | Nov | Dec |
|---|---|---|---|---|---|---|---|---|---|---|---|---|
| 2005 | -1 | -1 | ||||||||||
| 2007 | 0 | 0 | ||||||||||
| 2010 | 0 | 0 | ||||||||||
| 2014 | 0 | |||||||||||
| 2016 | -9 | -4 | ||||||||||
| 2017 | -36 | -9 | -9 | -9 | -9 | -26 | -38 | -9 | ||||
| 2018 | -19 | -18 | -10 | -19 | -18 | -38 | -58 | -75 | -10 | |||
| 2019 | -19 | -21 | -47 | -95 | -18 | -43 | -10 | -77 | -83 | -19 | ||
| 2020 | -19 | -27 | -10 | -38 | -82 | -38 | -56 | -56 | -62 | -66 | -118 | -83 |
| 2021 | -92 | -61 | -75 | -29 | -75 | -73 | -74 | -74 | -87 | -76 | -58 | -64 |
| 2022 | -28 | -21 | -83 | -48 | -56 | -52 | -24 | -46 | -47 | -44 | -50 | -45 |
| 2023 | -74 | -52 | -52 | -38 | -25 | -26 | -28 | -66 | -58 | -74 | -74 | -57 |
| 2024 | -44 | |||||||||||
| - = No Data Reported; -- = Not Applicable; NA = Not Available; W = Withheld to avoid disclosure of individual company data. |
| Release Date: 3/29/2024 |
| Next Release Date: 4/30/2024 |