|
Download Data (XLS File) |
|
||||||||
|
||||||||
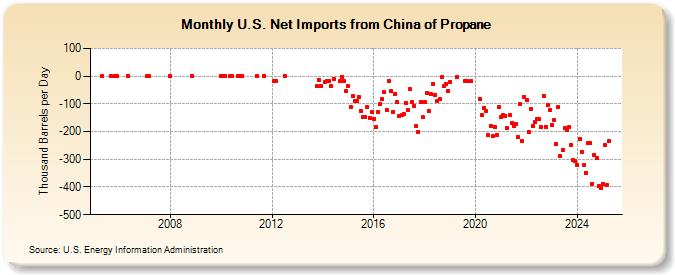
| U.S. Net Imports from China of Propane (Thousand Barrels per Day) | ||||||||
| Year | Jan | Feb | Mar | Apr | May | Jun | Jul | Aug | Sep | Oct | Nov | Dec |
|---|---|---|---|---|---|---|---|---|---|---|---|---|
| 2005 | 0 | 0 | 0 | 0 | ||||||||
| 2006 | 0 | |||||||||||
| 2007 | 0 | 0 | ||||||||||
| 2008 | 0 | 0 | ||||||||||
| 2010 | -1 | 0 | 0 | 0 | 0 | 0 | -1 | -1 | ||||
| 2011 | 0 | 0 | ||||||||||
| 2012 | -19 | -18 | 0 | |||||||||
| 2013 | -36 | -13 | -37 | |||||||||
| 2014 | -21 | -19 | -19 | -37 | -10 | -19 | -2 | -19 | -55 | |||
| 2015 | -35 | -113 | -70 | -91 | -91 | -77 | -126 | -149 | -149 | -113 | -150 | -130 |
| 2016 | -153 | -185 | -130 | -99 | -84 | -59 | -121 | -19 | -54 | -129 | -63 | -95 |
| 2017 | -145 | -141 | -136 | -96 | -121 | -48 | -93 | -107 | -181 | -201 | -93 | -149 |
| 2018 | -93 | -62 | -127 | -66 | -28 | -67 | -91 | -82 | -5 | -37 | -29 | -55 |
| 2019 | -22 | -5 | -19 | -19 | -19 | |||||||
| 2020 | -82 | -139 | -114 | -125 | -213 | -179 | -217 | -183 | -213 | -111 | ||
| 2021 | -146 | -141 | -143 | -188 | -141 | -170 | -181 | -172 | -219 | -102 | -235 | -74 |
| 2022 | -85 | -201 | -117 | -180 | -166 | -155 | -155 | -184 | -71 | -182 | -105 | -122 |
| 2023 | -180 | -133 | -211 | -117 | -289 | -304 | -196 | -164 | -164 | -247 | -301 | -270 |
| 2024 | -320 | -227 | -272 | -320 | ||||||||
| - = No Data Reported; -- = Not Applicable; NA = Not Available; W = Withheld to avoid disclosure of individual company data. |
| Release Date: 6/28/2024 |
| Next Release Date: 7/31/2024 |