|
Download Data (XLS File) |
|
||||||||
|
||||||||
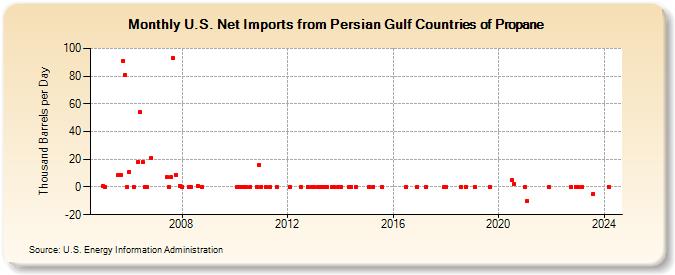
| U.S. Net Imports from Persian Gulf Countries of Propane (Thousand Barrels per Day) | ||||||||
| Year | Jan | Feb | Mar | Apr | May | Jun | Jul | Aug | Sep | Oct | Nov | Dec |
|---|---|---|---|---|---|---|---|---|---|---|---|---|
| 2005 | 1 | 0 | 9 | 9 | 91 | 81 | 0 | |||||
| 2006 | 11 | 0 | 18 | 54 | 18 | 0 | 0 | 21 | ||||
| 2007 | 7 | 0 | 7 | 93 | 9 | 1 | ||||||
| 2008 | 0 | 0 | 0 | 1 | 0 | |||||||
| 2010 | 0 | 0 | 0 | 0 | 0 | 0 | 0 | 16 | ||||
| 2011 | 0 | 0 | 0 | 0 | ||||||||
| 2012 | 0 | 0 | 0 | 0 | ||||||||
| 2013 | 0 | 0 | 0 | 0 | 0 | 0 | 0 | 0 | 0 | |||
| 2014 | 0 | 0 | 0 | 0 | ||||||||
| 2015 | 0 | 0 | 0 | |||||||||
| 2016 | 0 | 0 | ||||||||||
| 2017 | 0 | 0 | ||||||||||
| 2018 | 0 | 0 | 0 | |||||||||
| 2019 | 0 | 0 | ||||||||||
| 2020 | 5 | 2 | ||||||||||
| 2021 | 0 | -10 | 0 | |||||||||
| 2022 | 0 | 0 | ||||||||||
| 2023 | 0 | 0 | -5 | |||||||||
| - = No Data Reported; -- = Not Applicable; NA = Not Available; W = Withheld to avoid disclosure of individual company data. |
| Release Date: 3/29/2024 |
| Next Release Date: 4/30/2024 |