|
Download Data (XLS File) |
|
||||||||
|
||||||||
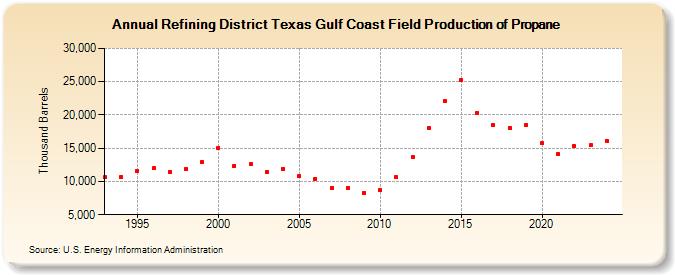
| Refining District Texas Gulf Coast Field Production of Propane (Thousand Barrels) | ||||||||
| Decade | Year-0 | Year-1 | Year-2 | Year-3 | Year-4 | Year-5 | Year-6 | Year-7 | Year-8 | Year-9 |
|---|---|---|---|---|---|---|---|---|---|---|
| 1990's | 10,612 | 10,737 | 11,549 | 11,950 | 11,480 | 11,883 | 12,946 | |||
| 2000's | 15,086 | 12,396 | 12,566 | 11,470 | 11,936 | 10,807 | 10,420 | 9,032 | 8,959 | 8,332 |
| 2010's | 8,728 | 10,596 | 13,663 | 18,033 | 22,087 | 25,201 | 20,255 | 18,456 | 18,077 | 18,453 |
| 2020's | 15,721 | 14,152 | 15,279 | 15,460 |
| - = No Data Reported; -- = Not Applicable; NA = Not Available; W = Withheld to avoid disclosure of individual company data. |
| Release Date: 3/29/2024 |
| Next Release Date: 8/30/2024 |