|
Download Data (XLS File) |
|
||||||||
|
||||||||
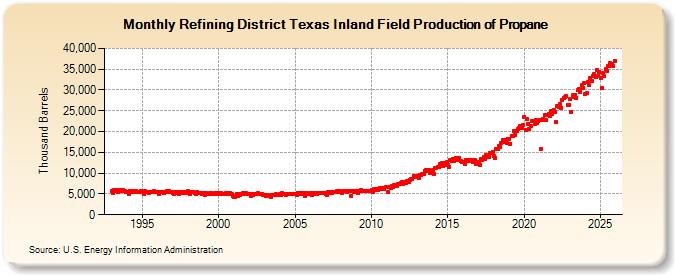
| Refining District Texas Inland Field Production of Propane (Thousand Barrels) | ||||||||
| Year | Jan | Feb | Mar | Apr | May | Jun | Jul | Aug | Sep | Oct | Nov | Dec |
|---|---|---|---|---|---|---|---|---|---|---|---|---|
| 1993 | 5,691 | 5,320 | 5,862 | 5,759 | 5,857 | 5,582 | 5,921 | 5,794 | 5,669 | 5,913 | 5,623 | 5,455 |
| 1994 | 5,523 | 5,056 | 5,725 | 5,505 | 5,590 | 5,496 | 5,672 | 5,707 | 5,520 | 5,578 | 5,474 | 5,728 |
| 1995 | 5,536 | 5,084 | 5,620 | 5,450 | 5,447 | 5,270 | 5,478 | 5,539 | 5,437 | 5,607 | 5,505 | 5,403 |
| 1996 | 5,475 | 5,002 | 5,534 | 5,409 | 5,523 | 5,257 | 5,573 | 5,594 | 5,401 | 5,664 | 5,412 | 5,478 |
| 1997 | 5,212 | 4,992 | 5,482 | 5,246 | 5,357 | 5,042 | 5,346 | 5,453 | 5,268 | 5,460 | 5,321 | 5,459 |
| 1998 | 5,627 | 5,068 | 5,527 | 5,418 | 5,443 | 5,151 | 4,981 | 5,374 | 5,171 | 5,307 | 5,107 | 5,049 |
| 1999 | 5,125 | 4,755 | 5,245 | 5,066 | 5,072 | 5,123 | 5,240 | 5,089 | 5,053 | 5,219 | 5,044 | 5,154 |
| 2000 | 5,104 | 4,864 | 5,187 | 5,003 | 4,985 | 5,009 | 5,198 | 5,261 | 5,061 | 5,182 | 4,942 | 4,416 |
| 2001 | 4,202 | 4,254 | 4,924 | 4,586 | 4,958 | 4,858 | 4,969 | 5,116 | 5,063 | 5,239 | 4,949 | 5,033 |
| 2002 | 4,962 | 4,606 | 5,013 | 4,785 | 5,068 | 4,906 | 4,995 | 5,126 | 5,002 | 5,092 | 5,007 | 4,855 |
| 2003 | 4,844 | 4,422 | 4,772 | 4,657 | 4,442 | 4,335 | 4,649 | 4,785 | 4,720 | 4,917 | 4,854 | 4,778 |
| 2004 | 5,008 | 4,780 | 5,115 | 4,868 | 4,906 | 4,755 | 5,012 | 5,027 | 4,926 | 5,101 | 4,868 | 4,953 |
| 2005 | 5,025 | 4,753 | 5,244 | 5,101 | 5,148 | 4,944 | 5,236 | 5,169 | 4,435 | 5,151 | 5,034 | 4,921 |
| 2006 | 5,339 | 4,763 | 5,263 | 5,081 | 5,175 | 5,049 | 5,201 | 5,178 | 5,222 | 5,334 | 5,149 | 5,241 |
| 2007 | 5,089 | 4,775 | 5,387 | 5,112 | 5,409 | 5,268 | 5,521 | 5,489 | 5,480 | 5,734 | 5,517 | 5,615 |
| 2008 | 5,521 | 5,333 | 5,680 | 5,648 | 5,780 | 5,436 | 5,666 | 5,653 | 4,615 | 5,598 | 5,527 | 5,546 |
| 2009 | 5,739 | 5,137 | 5,801 | 5,674 | 5,961 | 5,658 | 5,696 | 5,696 | 5,650 | 5,812 | 5,706 | 5,659 |
| 2010 | 5,898 | 5,396 | 6,096 | 5,904 | 6,178 | 5,885 | 6,161 | 6,311 | 6,239 | 6,453 | 6,233 | 6,559 |
| 2011 | 6,549 | 5,407 | 6,768 | 6,442 | 6,913 | 6,680 | 7,145 | 7,071 | 6,946 | 7,456 | 7,400 | 7,651 |
| 2012 | 7,756 | 7,354 | 7,776 | 7,736 | 8,190 | 7,943 | 8,466 | 8,652 | 8,622 | 9,214 | 9,155 | 9,237 |
| 2013 | 9,344 | 8,797 | 9,571 | 9,476 | 9,880 | 9,789 | 10,506 | 10,660 | 10,490 | 10,844 | 10,044 | 10,359 |
| 2014 | 10,663 | 9,710 | 11,115 | 11,189 | 11,557 | 11,537 | 12,092 | 12,348 | 11,661 | 12,342 | 11,885 | 12,589 |
| 2015 | 11,911 | 11,482 | 13,045 | 13,022 | 13,338 | 13,031 | 13,557 | 13,531 | 13,197 | 13,589 | 12,976 | 12,781 |
| 2016 | 12,702 | 12,228 | 13,172 | 12,798 | 13,162 | 12,828 | 13,192 | 13,140 | 12,615 | 13,067 | 12,316 | 12,264 |
| 2017 | 12,765 | 11,974 | 13,515 | 13,211 | 13,910 | 13,492 | 14,334 | 14,002 | 13,766 | 14,925 | 14,852 | 15,092 |
| 2018 | 14,024 | 13,721 | 15,894 | 15,764 | 16,620 | 16,302 | 17,318 | 17,872 | 17,487 | 18,060 | 17,287 | 18,209 |
| 2019 | 18,184 | 17,116 | 19,045 | 18,884 | 20,020 | 19,175 | 20,148 | 20,518 | 20,817 | 21,375 | 20,785 | 21,614 |
| 2020 | 23,577 | 20,400 | 23,028 | 21,885 | 20,722 | 21,293 | 22,633 | 22,652 | 21,896 | 22,760 | 22,176 | 22,465 |
| 2021 | 22,828 | 15,697 | 22,818 | 23,044 | 23,869 | 22,890 | 24,055 | 24,106 | 23,800 | 24,882 | 24,250 | 25,288 |
| 2022 | 24,594 | 22,315 | 26,135 | 26,021 | 26,565 | 25,766 | 27,647 | 28,084 | 28,290 | 28,491 | 26,306 | 26,458 |
| 2023 | 26,319 | 23,506 | 27,693 | 27,180 | 28,519 | 27,715 | 29,481 | 29,800 | 29,526 | 30,782 | 30,262 | 30,921 |
| 2024 | 29,131 | |||||||||||
| - = No Data Reported; -- = Not Applicable; NA = Not Available; W = Withheld to avoid disclosure of individual company data. |
| Release Date: 3/29/2024 |
| Next Release Date: 4/30/2024 |