|
Download Data (XLS File) |
|
||||||||
|
||||||||
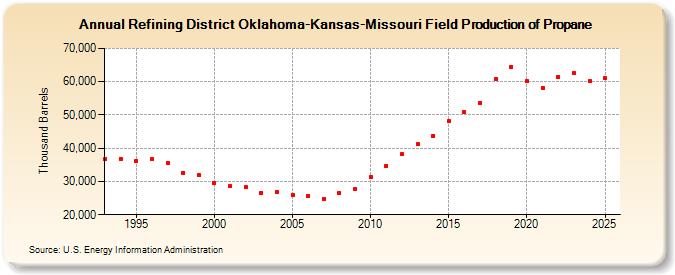
| Refining District Oklahoma-Kansas-Missouri Field Production of Propane (Thousand Barrels) | ||||||||
| Decade | Year-0 | Year-1 | Year-2 | Year-3 | Year-4 | Year-5 | Year-6 | Year-7 | Year-8 | Year-9 |
|---|---|---|---|---|---|---|---|---|---|---|
| 1990's | 36,600 | 36,848 | 36,187 | 36,610 | 35,578 | 32,689 | 31,871 | |||
| 2000's | 29,602 | 28,672 | 28,277 | 26,617 | 26,834 | 25,880 | 25,643 | 24,841 | 26,571 | 27,699 |
| 2010's | 31,422 | 34,788 | 38,109 | 41,217 | 43,765 | 48,027 | 50,845 | 53,592 | 60,679 | 64,523 |
| 2020's | 60,115 | 58,178 | 61,342 | 62,926 |
| - = No Data Reported; -- = Not Applicable; NA = Not Available; W = Withheld to avoid disclosure of individual company data. |
| Release Date: 3/29/2024 |
| Next Release Date: 8/30/2024 |