|
Download Data (XLS File) |
|
||||||||
|
||||||||
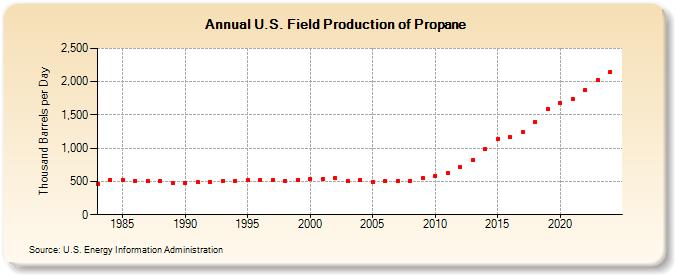
| U.S. Field Production of Propane (Thousand Barrels per Day) | ||||||||
| Decade | Year-0 | Year-1 | Year-2 | Year-3 | Year-4 | Year-5 | Year-6 | Year-7 | Year-8 | Year-9 |
|---|---|---|---|---|---|---|---|---|---|---|
| 1980's | 463 | 527 | 521 | 508 | 503 | 506 | 471 | |||
| 1990's | 474 | 487 | 499 | 513 | 510 | 519 | 525 | 528 | 513 | 529 |
| 2000's | 539 | 538 | 549 | 506 | 526 | 499 | 501 | 507 | 512 | 546 |
| 2010's | 586 | 631 | 712 | 823 | 985 | 1,144 | 1,166 | 1,236 | 1,401 | 1,589 |
| 2020's | 1,682 | 1,744 | 1,871 | 2,009 |
| - = No Data Reported; -- = Not Applicable; NA = Not Available; W = Withheld to avoid disclosure of individual company data. |
| Release Date: 3/29/2024 |
| Next Release Date: 8/30/2024 |