|
Download Data (XLS File) |
|
||||||||
|
||||||||
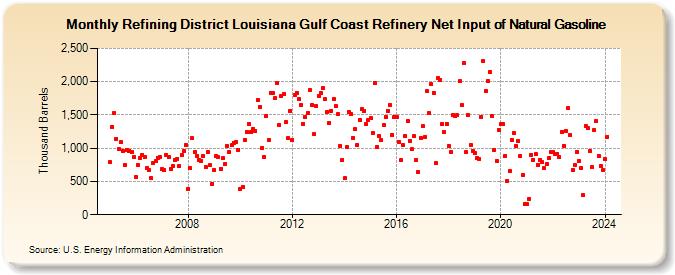
| Refining District Louisiana Gulf Coast Refinery Net Input of Natural Gasoline (Thousand Barrels) | ||||||||
| Year | Jan | Feb | Mar | Apr | May | Jun | Jul | Aug | Sep | Oct | Nov | Dec |
|---|---|---|---|---|---|---|---|---|---|---|---|---|
| 2005 | 787 | 1,325 | 1,532 | 1,144 | 988 | 1,086 | 961 | 745 | 979 | 964 | 942 | 865 |
| 2006 | 567 | 744 | 857 | 902 | 867 | 705 | 671 | 548 | 776 | 800 | 858 | 866 |
| 2007 | 687 | 672 | 895 | 868 | 686 | 734 | 818 | 844 | 729 | 896 | 954 | 1,050 |
| 2008 | 392 | 698 | 1,146 | 938 | 886 | 828 | 812 | 887 | 722 | 939 | 741 | 467 |
| 2009 | 671 | 882 | 866 | 692 | 846 | 763 | 1,033 | 939 | 1,042 | 1,085 | 1,092 | 977 |
| 2010 | 392 | 424 | 1,124 | 1,236 | 1,367 | 1,248 | 1,293 | 1,258 | 1,721 | 1,626 | 1,008 | 860 |
| 2011 | 1,489 | 1,123 | 1,834 | 1,826 | 1,753 | 1,975 | 1,347 | 1,777 | 1,816 | 1,390 | 1,148 | 1,561 |
| 2012 | 1,122 | 1,794 | 1,836 | 1,742 | 1,643 | 1,369 | 1,468 | 1,527 | 1,871 | 1,651 | 1,206 | 1,630 |
| 2013 | 1,790 | 1,830 | 1,904 | 1,734 | 1,545 | 1,384 | 1,564 | 1,738 | 1,633 | 1,509 | 1,029 | 828 |
| 2014 | 548 | 1,015 | 1,549 | 1,513 | 1,160 | 1,282 | 1,046 | 1,429 | 1,585 | 1,562 | 1,360 | 1,421 |
| 2015 | 1,451 | 1,229 | 1,984 | 1,022 | 1,178 | 1,121 | 1,343 | 1,470 | 1,566 | 1,650 | 1,199 | 1,473 |
| 2016 | 1,468 | 1,098 | 818 | 1,044 | 1,185 | 1,412 | 1,113 | 981 | 1,181 | 822 | 642 | 1,152 |
| 2017 | 1,326 | 1,173 | 1,854 | 1,523 | 1,958 | 1,832 | 777 | 2,054 | 2,030 | 1,358 | 1,236 | 1,367 |
| 2018 | 1,034 | 948 | 1,492 | 1,478 | 1,495 | 2,003 | 1,646 | 2,277 | 939 | 1,497 | 1,053 | 964 |
| 2019 | 927 | 857 | 840 | 1,469 | 2,304 | 1,863 | 2,014 | 2,148 | 1,477 | 978 | 810 | 1,278 |
| 2020 | 1,360 | 1,358 | 880 | 504 | 656 | 1,130 | 1,227 | 1,029 | 1,107 | 880 | 597 | 162 |
| 2021 | 159 | 241 | 902 | 828 | 906 | 754 | 827 | 786 | 698 | 760 | 845 | 941 |
| 2022 | 939 | 909 | 917 | 866 | 1,248 | 1,038 | 1,262 | 1,603 | 1,200 | 679 | 746 | 947 |
| 2023 | 812 | 696 | 292 | 1,332 | 1,297 | 952 | 719 | 1,277 | 1,408 | 888 | 735 | 665 |
| 2024 | 833 | |||||||||||
| - = No Data Reported; -- = Not Applicable; NA = Not Available; W = Withheld to avoid disclosure of individual company data. |
| Release Date: 3/29/2024 |
| Next Release Date: 4/30/2024 |