|
Download Data (XLS File) |
|
||||||||
|
||||||||
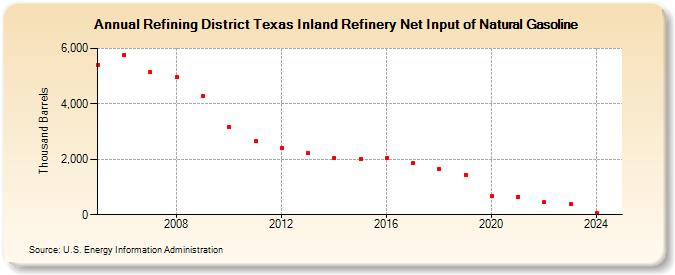
| Refining District Texas Inland Refinery Net Input of Natural Gasoline (Thousand Barrels) | ||||||||
| Decade | Year-0 | Year-1 | Year-2 | Year-3 | Year-4 | Year-5 | Year-6 | Year-7 | Year-8 | Year-9 |
|---|---|---|---|---|---|---|---|---|---|---|
| 2000's | 5,407 | 5,766 | 5,142 | 4,971 | 4,290 | |||||
| 2010's | 3,155 | 2,656 | 2,419 | 2,229 | 2,063 | 2,014 | 2,035 | 1,860 | 1,660 | 1,439 |
| 2020's | 684 | 648 | 448 | 382 |
| - = No Data Reported; -- = Not Applicable; NA = Not Available; W = Withheld to avoid disclosure of individual company data. |
| Release Date: 3/29/2024 |
| Next Release Date: 8/30/2024 |
Referring Pages: